Feeds:
Posts
Comments

Posts Tagged ‘science education’

A 3D model of Tyrian purple, the ancient Phoenician dye extracted from murex sea snails.

This blog is the script for a final video project for my Educational Technology class as a doctoral candidate at the University of Northern Colorado. The final video can be viewed at: https://youtu.be/jimJqjsetNM.

Introduction

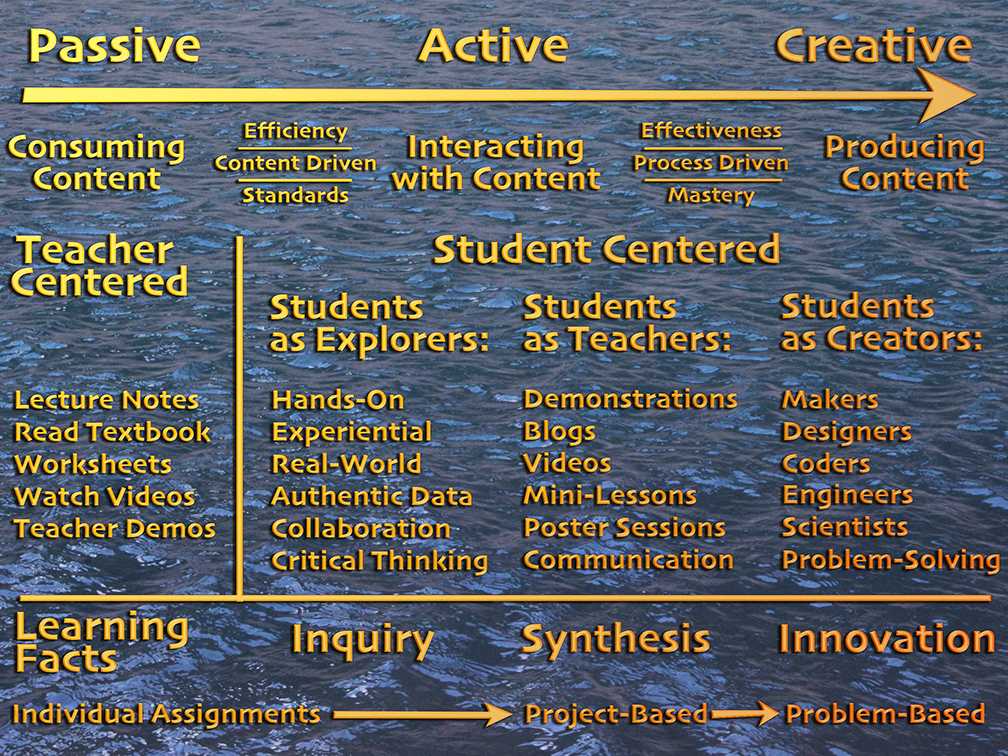
3D modeling and printing are taking the Do-it-Yourself world by storm as makerspaces spring up in many schools. Considered to be an innovative way of learning next-generation skills, 3D modeling and printing are fun hobbies, but are they effective educational tools? Is 3D technology worth the cost and the time it takes to learn? Will a 3D printer merely sit in the corner and collect dust, or will it be frequently and effectively used to teach class concepts? Is 3D printing just another new toy or is it a pedagogically sound method for deep learning?

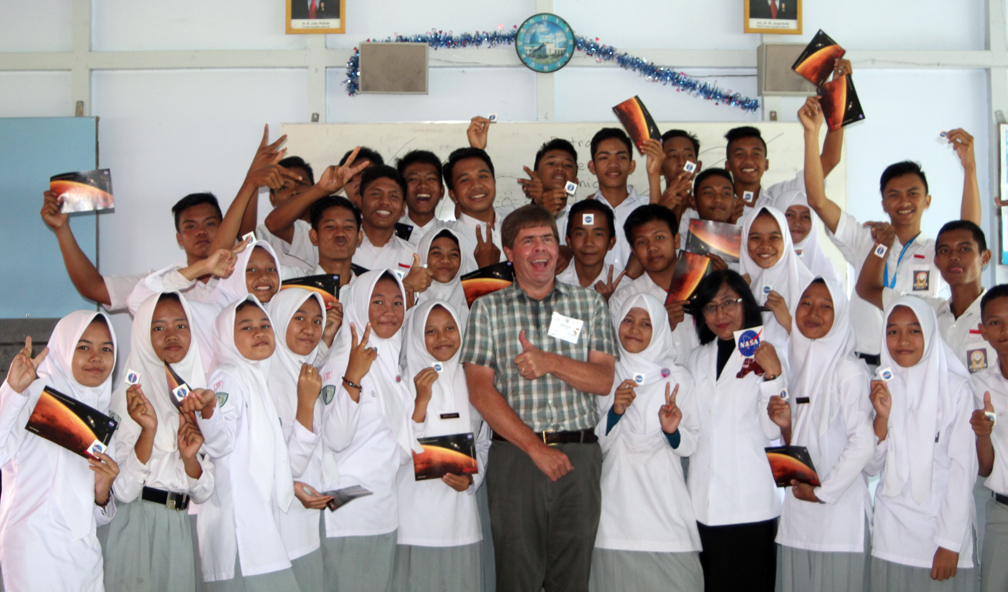
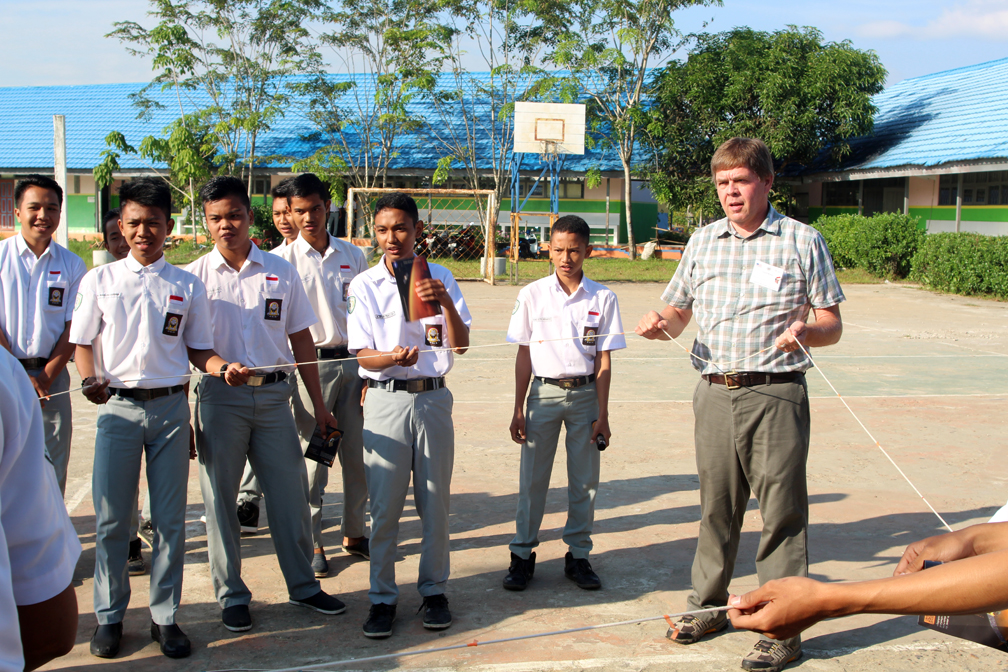
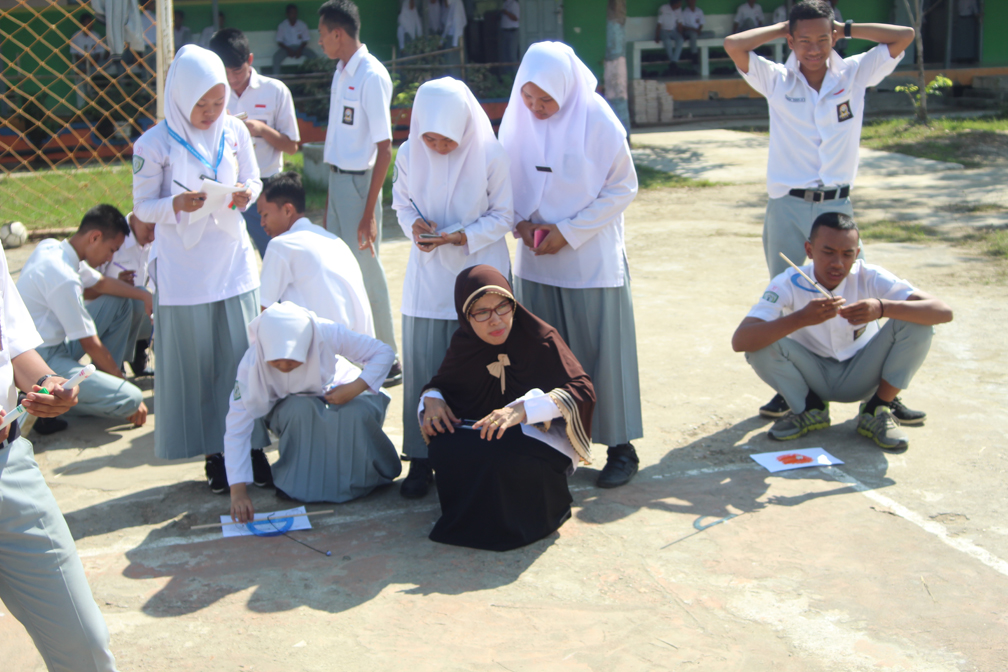
My name is David Black and I have taught media design and science classes for 30 years at the secondary level. I have developed multi-disciplinary projects that combine science with 3D modeling, but I lacked a theoretical framework. This video explores the history and innovation of 3D modeling and printing within a theoretical framework of constructivism and a project-based learning pedagogy to effectively teach science concepts. We will look at the diffusion of this new technology, how it works as a medium to convey learning, the basic steps and history of producing 3D models and prints, and provide examples of 3D technology use in science classrooms.

A photo gallery interface for the AM to FM project. Designed as a scrapbook, the animation zoomed into the pages and each item became a category for different images that could be viewed interactively. The entire interface was programmed in Macromedia Director.

A Theoretical Framework

When students create their own science educational content, or learner-generated digital media (LGDM), they achieve a deeper understanding of the science. Researchers have found that students not only learn science content well through media creation, they also develop marketable media design and 21st century skills of collaboration, communication, critical thinking, and creativity (Hoban, Nielsen, & Shepherd, 2013; Orus, et al., 2016; Reyna, 2021).

Reyna and Meier (2018) conducted a literature review of studies that use learner-generated digital media to teach science concepts. They concluded that previous studies were limited because they lacked theoretical frameworks or sound pedagogy. These researchers assumed that the participating students already knew how to use media design technology tools since they were so-called “digital natives.” According to Reyna and Meier, just because students grow up using computers and digital devices doesn’t mean they have ever developed media creation skills such as video editing or 3D modeling. In a follow up study, Reyna scaffolded media design skills training through smaller partial projects embedded in a theoretical framework of constructivism and a project-based learning (Reyna & Meier, 2018; Reyna, 2021). As an example, a teacher might have a student team create a short Public Service Announcement (PSA) as a practice project to gain skills in using cameras, lighting, and microphones and to learn the entire video creation process or workflow before tackling the final project.

A final (?) version of my model of constructivism, with students as explorers, teachers, content creators, makers, designers, coders, engineers, scientists, critical thinkers, collaborators, communicators, and problem-solvers. My model suggests that students need to move from being passive learners to becoming active and creative learners.

Constructivist theory proposes that learning is a socially mediated cognitive process whereby learners experience a subject and construct their own meanings for it. They create mind maps or schema that tie previous learning, emotions, and social reinforcement together with their new knowledge. Schema develop through the processes of assimilation, where the new knowledge is placed into existing categories, and accommodation, where the schema are revised to acknowledge divergent information. Constructivism acknowledges that the learner is at the center of the process.

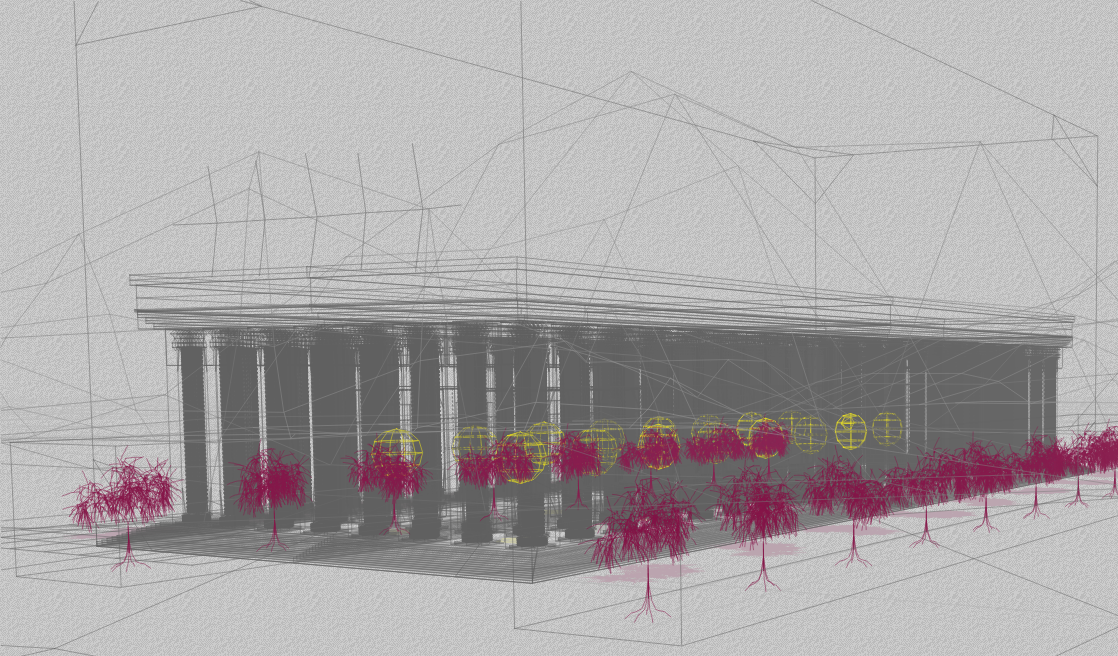
3D modeling is inherently a constructivist activity, as creating the models literally requires constructing one polygon or primitive at a time. That the model exists only in virtual space does not mean it is any less a constructed medium. By 3D printing the virtual model, the printer builds an actual model one layer at a time. If properly planned and conceived, students can also construct science knowledge through 3D modeling and animation. Instead of consuming scientific content, students become producers of content. They become the experts and the teachers, and learning occurs as a natural byproduct of the process.

Lev Vygotsky was a pioneer of constructivist theory. He also developed the concept of the Zone of Proximal Development shown in the image at right.

Constructivist theory can be traced all the way back to Socrates, who said, “Education is the kindling of a flame, not the filling of a vessel.” John Dewey proposed that students learn by doing, that is, in an active, creative process where they construct their own meanings through discovery with the teacher as a guide on the side, not the sage on the stage (Brau, 2020). It is the opposite of objectivism, where teachers are the center of the process and must somehow pour their knowledge into their students’ brains. Lev Vygotsky added that learning is socially mediated through interpersonal interactions, language, and culture and that students learn within their zone of proximal development; as students learn more, what they can do with help (the ZPD) expands (Brau, 2020). Jean Piaget developed cognitive constructivism where children develop naturally through various stages from concrete to abstract, with each stage of cognitive growth affecting the construction of learning (Brau, 2020). Seymour Papert developed his constructionist theory where students construct learning through making. He saw computers as a tool for learning and invention where students learn through doing and experimentation, including the use of computer programming and media design. Today’s makerspaces are based on his theories.

The characteristics of gold-standard project-based learning, as developed by PBLworks, formerly the Buck Institute for Education.

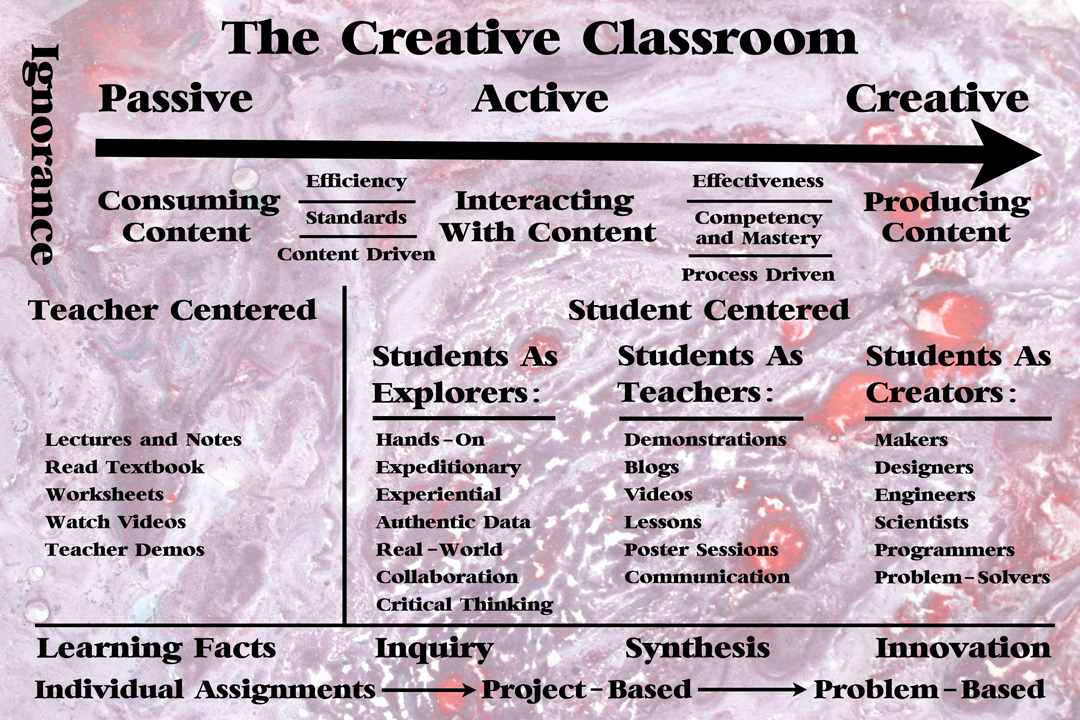
Project-Based Learning Pedagogy

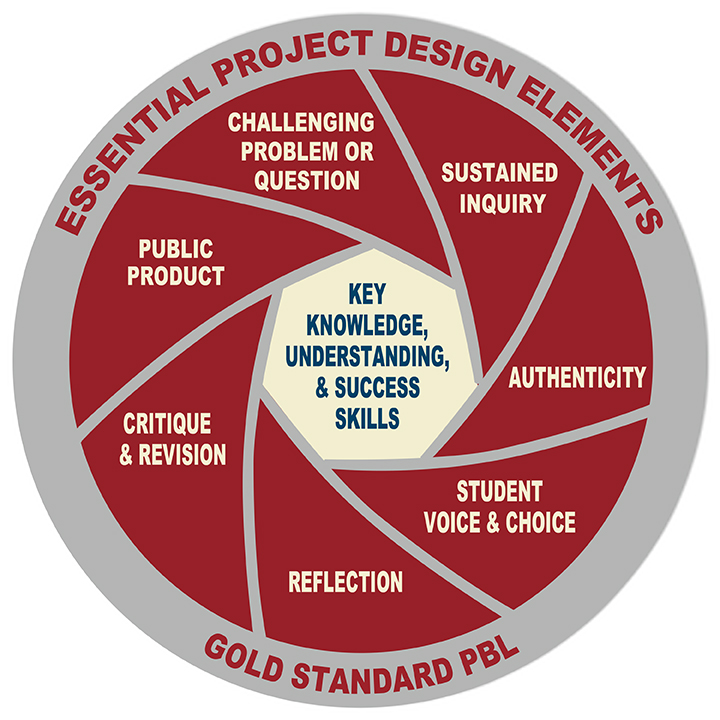
Project-based learning is a natural fit as a pedagogy for media design creation. It usually occurs in teams and the conclusion is a public product. According to PBLworks, formerly the Buck Institute for Education, gold-standard PBL includes seven characteristics (https://www.pblworks.org/):

(1) A challenging, meaningful question or problem to address; (2) Student inquiry using authentic data or sources where they discover the learning for themselves as a natural outgrowth of the initial question; (3) Student voice and choice in the type of project chosen and how it will be accomplished; (4) Collaboration and communication as students actively participate and work through issues creatively; (5) Frequent opportunities for critique and formative feedback, with revision; (6) A public presentation of the final product; and (7) Student reflection on what they have accomplished and learned.

Each project ends with a presentation before a public audience, usually at some type of back-to-school night with feedback and suggestions from the audience. Knowing that their work will have a public audience motivates students to deliver a high quality product and helps to actively engage them in the process of learning. As John Spencer, a well-known PBL guru, explains:

Students who engage in authentic project-based learning have increased agency and ownership. They’re often more excited and engaged in their learning. When this happens, they retain the information for a longer amount of time while also learning vital technology skills like digital citizenship and media literacy. However, they also learn vital soft skills, such as collaboration, communication, curation, and problem-solving. As they work through iterations and revise their work, they develop a growth mindset. Often, they learn how to seek out constructive feedback. This connection to the community can help them develop empathy (Spencer, 2021).

Marshall McLuhan invented the concept of the global village and was famous for saying that “the medium is the message.”

The Message and the Medium

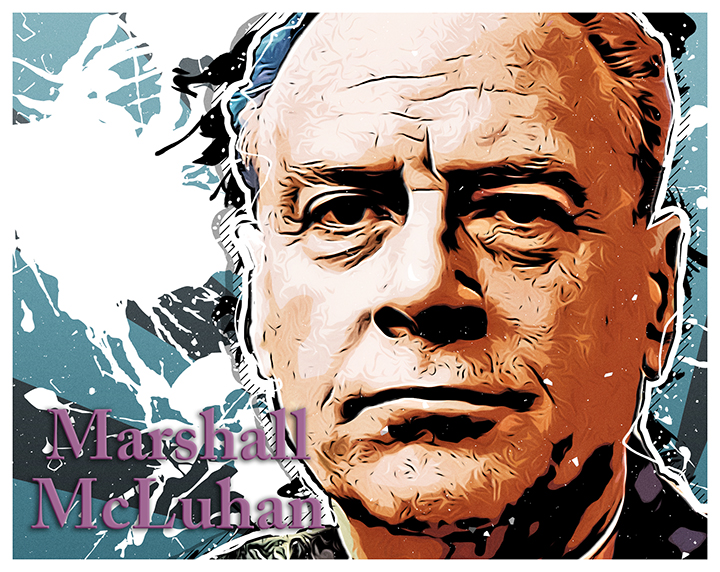
In the early 1960s, Marshall McLuhan created the concept of the global village, which predicting the interconnectivity of the World Wide Web, and famously stated that “the medium is the message.” Such technologies as print and movable type have a profound effect on the human psyche and cultural understandings. Humans re-invent themselves and how they communicate with the invention of each new medium (McLuhan, 1962). Richard Clark argued conversely in the 1990s that the medium of a message was unimportant to the learning process and that cost-effectiveness was the only consideration in choosing one medium over another in instructional design (Clark, 1994). If more than one form of media can be used for a particular learning task, then they are replaceable with each other and the medium does not influence the message. Robert Kozma (1994) takes a middle ground, similar to Kalantzis and Cope (2012), where the medium conveys or mediates the message, influencing the message because of the medium’s unique affordances (advantages, disadvantages, limitations, conventions, etc.). Learning from a video with its linear format is qualitatively different than learning from interactive media such a website or a CD-ROM-based multimedia title. Learning from printed text alone is different than learning from text with images, or moving text and images in the form of a video.

A simple chart can show a great deal of data, such as this one showing the growth of STEM related jobs from 2012 to 2020.

3D modeling and animation has its own affordances that allow it to present a unique learning experience unlike other media. It can visualize large datasets, allowing patterns and inter-relations between data to be understood that purely numeric data tables cannot. A chart of the stock market can lay out several indices together for comparison over time, representing over 80,000 different data points in one infographic, which would be impossible to interpret as raw data but is easily accessible visually (Krum, 2013). If the data represents values in a two-dimensional grid, then a 3D graph is the best way to visualize and understand the data, as in the example of the voltage data I will talk about later. The medium chosen to convey learning is therefore an essential part of the learning experience. This agrees most closely with Kozma’s middle ground stand on the Clark-McLuhan continuum (Kozma, 1994).

With this in mind, let us now turn to an examination of the history of 3D modeling and printing as an innovative technology and how it can be used in science classrooms.

The movie Tron by Disney broke new ground by including scenes that were completely made of 3D animations.

History of 3D Modeling

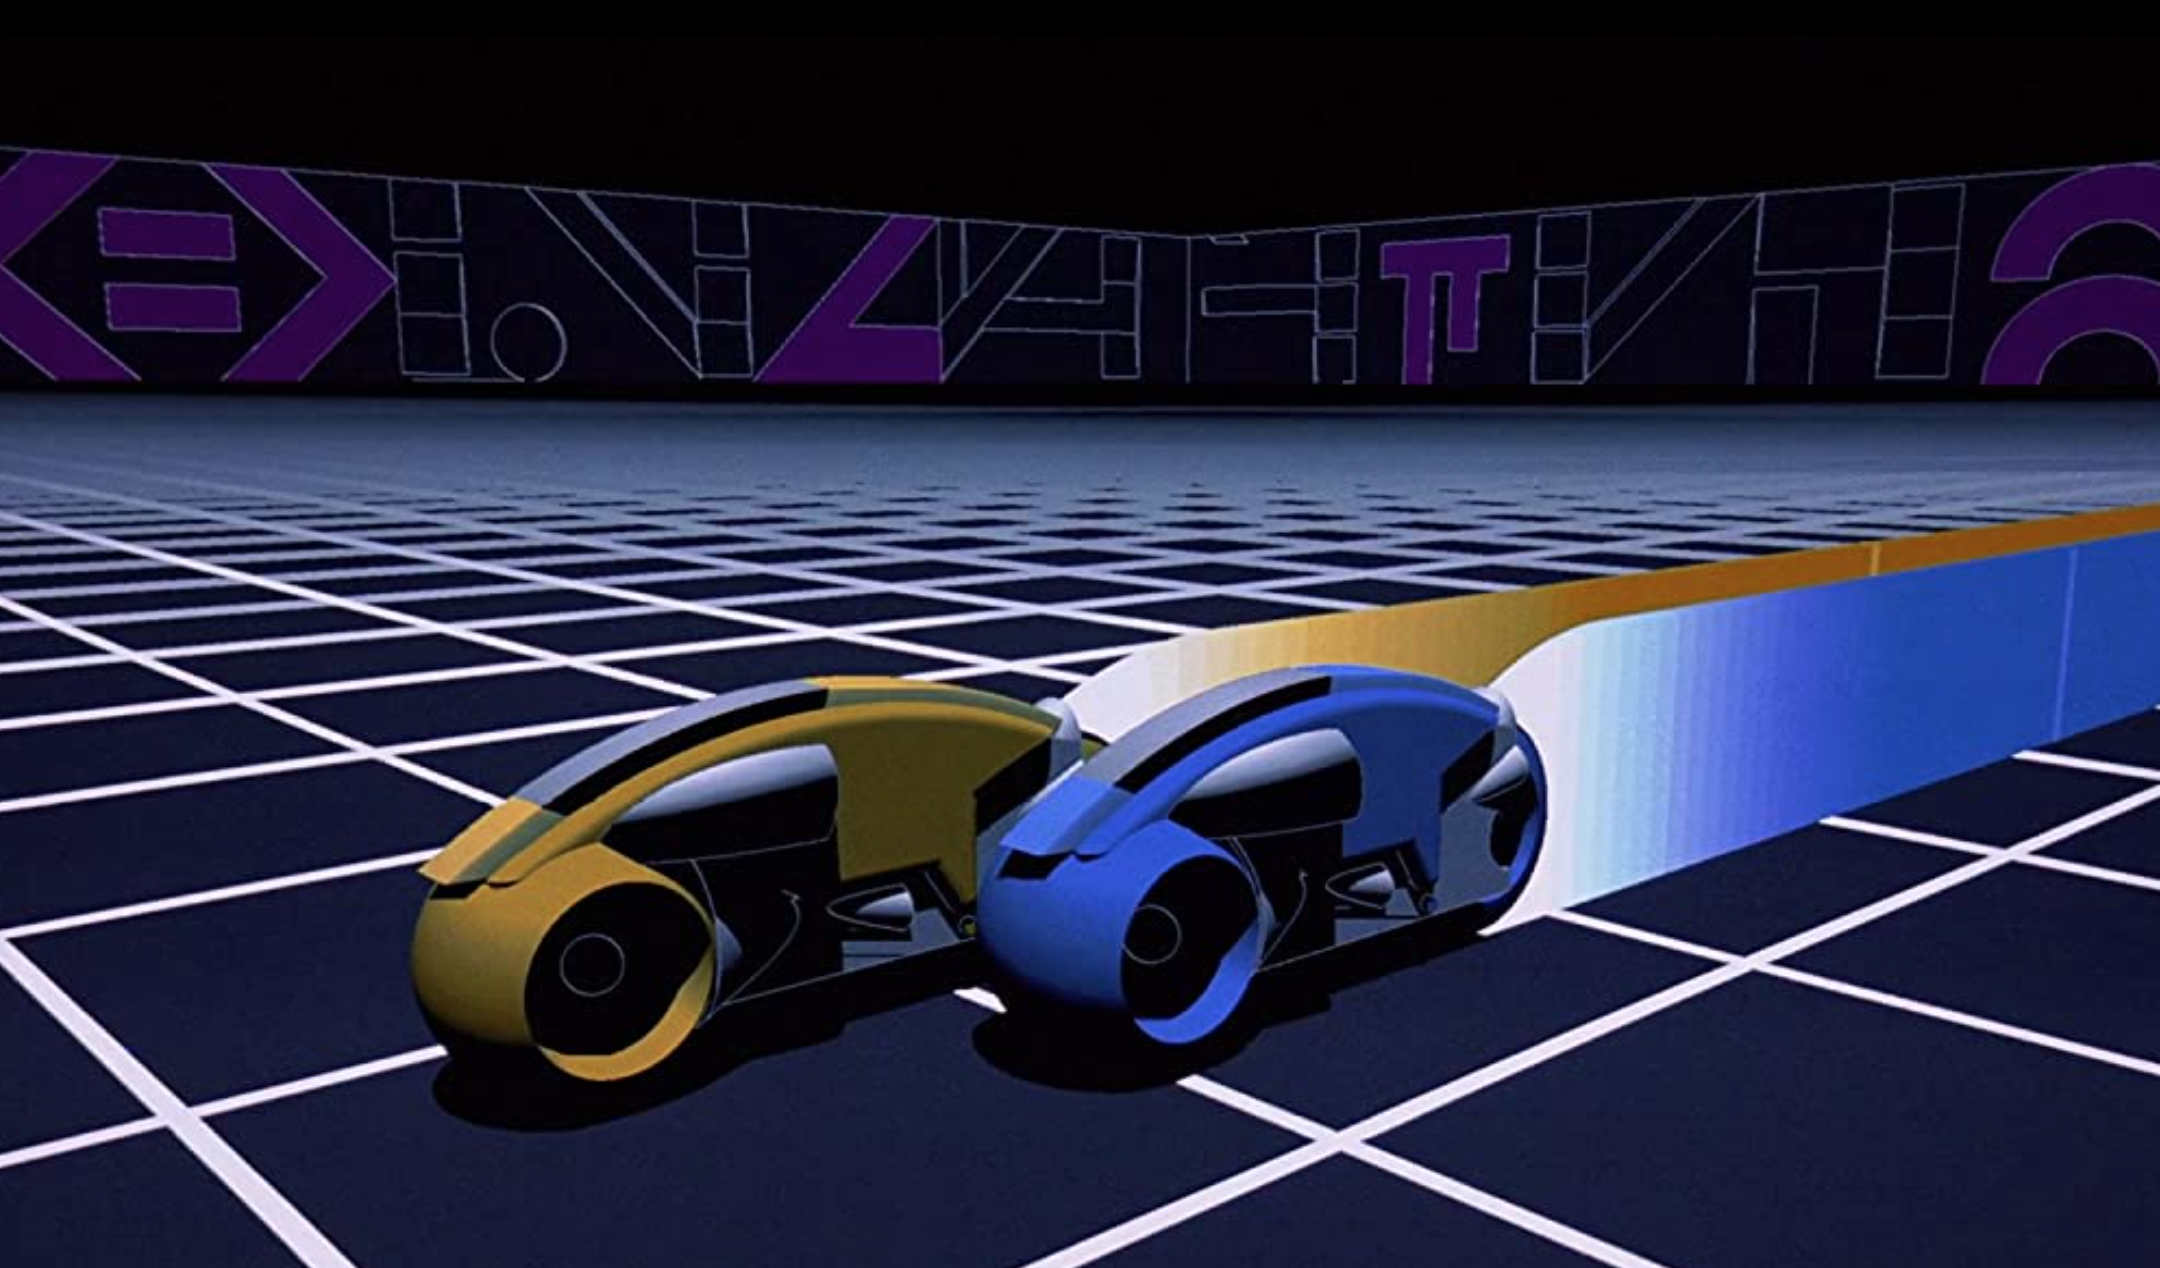
The first experiments with 3D computer modeling began in the 1970s using mainframe computers, the only ones that could handle the millions of calculations necessary. A group at the University of Utah’s computer lab led by Ed Catmull developed a process to build smoothly polygonal models with accurate reflections called raytracing. As microprocessors improved and computer speeds and power increased, the first entertainment applications appeared. By the early 1980s movie studios were experimenting with computer graphic inserts for special effects. Disney’s Tron brought complete scenes designed and rendered in 3D, followed by even more photorealistic effects in The Last Starfighter with complete Codon Armadas including spaceships, planets, and asteroids.

A still frame from Robert Abel & Associates’ “sexy robot” commercial during the 1984 Super Bowl. It was an advertisement for canned food . . . By the way, this was the same Super Bowl where the infamous “Big Brother” commercial introduced the Apple Macintosh computer.

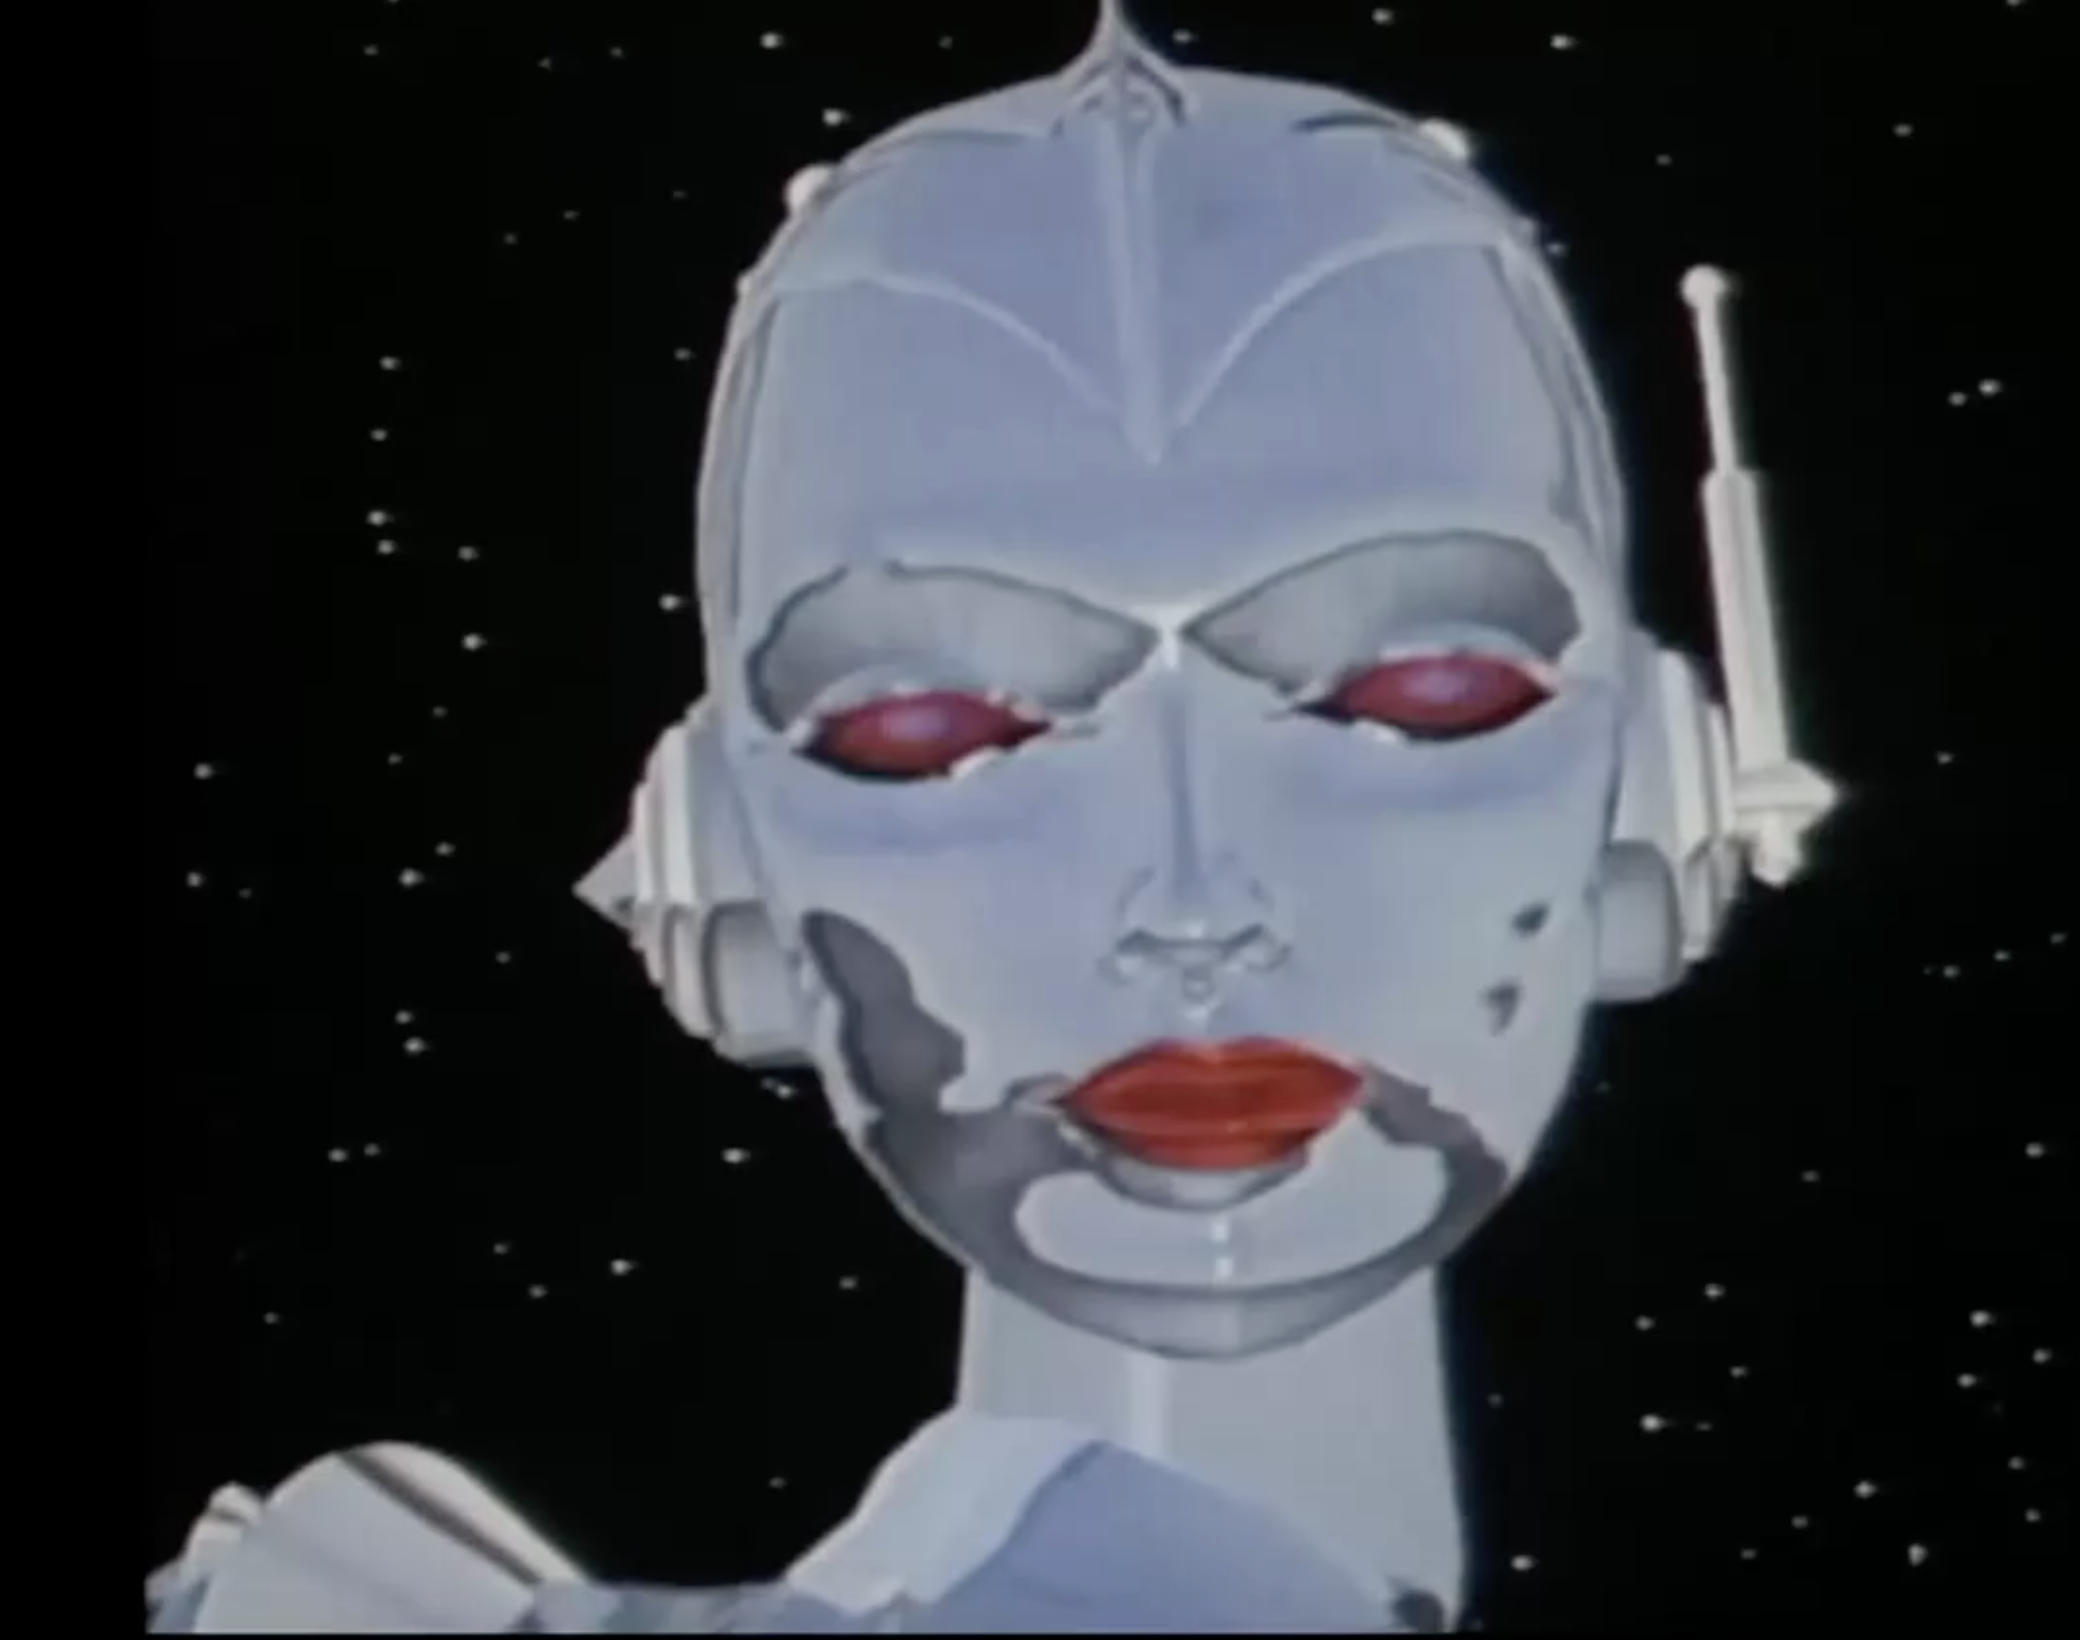
Meanwhile, some of the artists that started with Tron founded their own studios, including Robert Abel and Associates, who created a number of iconic and Clio Award-winning TV commercials including the famous 1984 Super Bowl sexy robot commercial that introduced innovative motion capture technology (Art of Computer Animation, n.d.). Lucas Films and Industrial Light and Magic experimented with completely 3D animated short movies. When Steve Jobs left Apple Computers and invested in the studio, they became Pixar Animation Studios and created the groundbreaking Luxo, Jr. animation. Jobs encouraged John Lasseter to create a full-length 3D movie; the result was Toy Story in 1995 and the rest is history.

History of 3D Printing

In 1981, Hideo Kodama of Nagoya Municipal Industrial Research Institute published a description of a liquid resin-based photopolymer that becomes solid by hardening each layer with focused ultraviolet light, but he did not file a patent (Goldberg, 2018). In 1984, Charles Hull invented a similar system called a stereolithography apparatus (SLA). Refinements continued, including building up layers by sending UV light in cross-sections. In 1992, the first Selective Laser Sintering (SLS) device was invented, which uses a laser beam to sinter or weld together a powder into layers.

The original MakerBot Thing-o-Matic, one of the first commercial 3D printers for home or school use.

Although both of these techniques are still used in high-end industry, the type of 3D printing most familiar in schools is the Fused Deposition Modeling (FDM) technique where a plastic filament on a spool is fed into the printer by a motor, melted by a heated nozzle, and deposited in layers continuously to make cross-sections (3Dsourced.com, 2019). For each layer, the build plate is moved down. It is also called Fused Filament Fabrication. This type of printing was first developed in the late 1980s by F. Scott Crump who went on to found Stratisys in 1990 as the first company to build FDM printers and plastic filament.

Altogether, these technologies are referred to as additive manufacturing because the models are built up, or added, layer by layer. By comparison, a 3D milling machine or CNC router uses subtractive manufacturing because it starts with a larger blank and carves away parts.

By 2009, when the first FDM patents expired, new companies entered the market with lower cost desktop 3D printing machines such as MakerBot, FlashForge, Prusa, Ultimaker, Dremmel, and others. Various types of plastic filament became available, including Polylactic Acid (PLA), Acrylonitrile Butadiene Styrene (ABS), and even flexible nylon filaments, fused metallic filaments, and water dissolvable filaments for printing supports. Filaments come in many colors and finishes, including filaments that change color as they spool into the printer. A new development is 3D printing in full color, however these printers cost $3500 or more. To print in color, 4-process color (CMYK) dyes are added to a base color filament as it extrudes.

The 3D process begins with primitive objects such as cylinders and spheres assembled in 3-dimensional space, as shown here in TinkerCAD. Boolean commands can use one object to cut holes in other objects.

The Process: From Model to Print

Many 3D models are available for free on Thingiverse (https://www.thingiverse.com/) and other sites, but ultimately the fun of 3D modeling is to do it yourself. Complicated by working in three-dimensional space on a two-dimensional computer screen, in 3D modeling primitive objects such as spheres, cubes, and cylinders are given textures and composed into scenes. They can be combined to add, cut, or intersect other objects using Boolean commands. Other objects are created using a polygonal mesh like chicken wire. Meshes act as three-dimensional vectors and can be modeled from equations and deformed using envelopes. Grayscale images can be converted into terrain objects with light areas as mountains and dark areas as valleys.

Primitive objects are shown as a wireframe model, sized and moved into a complete composition such as this Greek temple.

To create complete scenes, the objects are aligned and composed, the camera positioned, lighting and atmospherics provided along with other procedural effects, then rendered out through ray tracing as if the scene were being photographed by bouncing a beam of light out from the camera. To animate objects, a timeline is added and the objects are given hierarchical links from parent to child, a process called forward kinematics. The pieces can be moved, rotated, and otherwise changed over time by adding keyframes on the timeline. The computer then renders out an animation frame by frame, creating all the in-between frames itself. Complex characters can be rigged with bones and joints or morph targets to deform the polygonal structure over time.

Learning 3D animation is traditionally a difficult and time-consuming process, with each step from modeling to rigging to texturing to animating done by different teams of specialists for a major CGI-based motion picture. Teaching students how to do all of these steps competently can take several weeks of class time, if not years, which few teachers or subjects can afford to do. However, new tools are simplifying the process.

This model of a dinosaur has had bones and joints added, which can be rotated and animated to distort the wireframe model. This model can walk, thrash its tail, turn its neck and head, and eat unsuspecting time travelers.

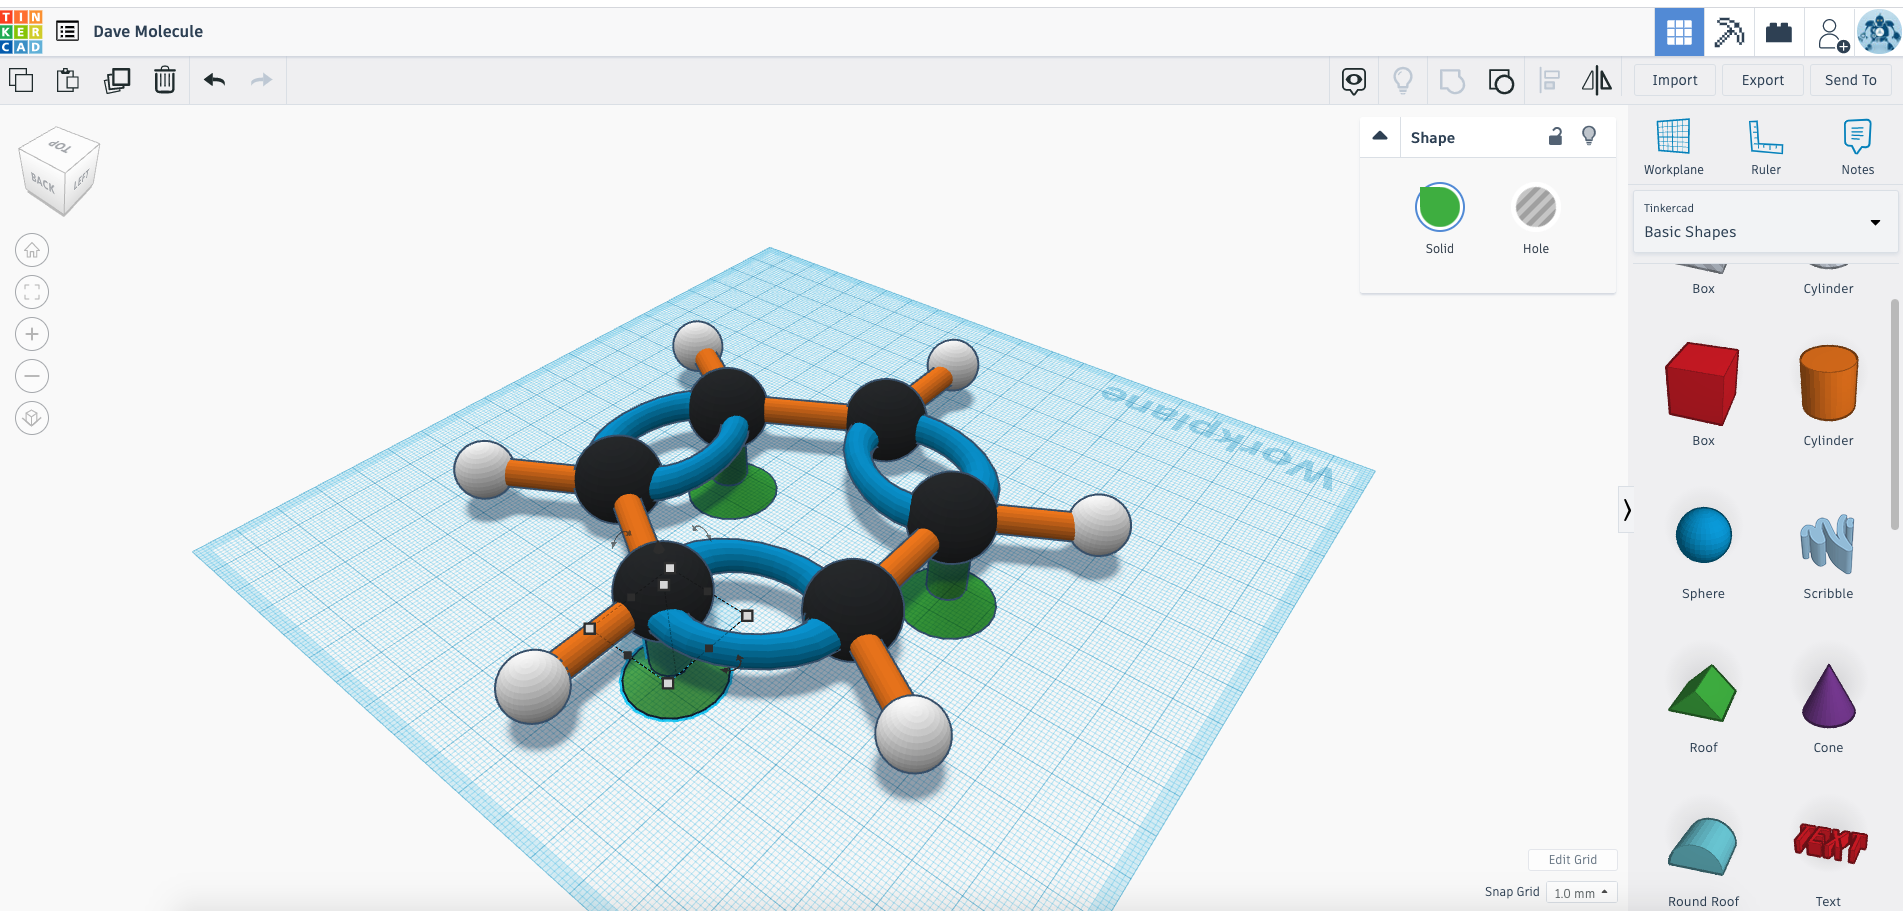
TinkerCAD is a browser-based modeling tool that has a range of primitive objects and simple textures that can be combined into more complex models, which can then be exported and printed with a 3D printer. It is not set up to do complex polygonal modeling or animation, but is a good introduction to working in three-dimensional space. SculptGL is another browser-based modeling tool. It does create complex meshes, but instead of subdividing polygons one at a time, the tool works as a ball of virtual clay that can be pushed and pulled. The model can be colored with paintbrushes and the final models and textures exported as .OBJ files for use in more sophisticated animation software. I have not yet found a browser-based tool that can assemble complete scenes, add keyframes, rig bones and morph targets, and render out animations. There are full-scale downloadable programs available for free or as educational licenses, including Blender and Autodesk Maya. Many tutorials exist online for how to use these programs.

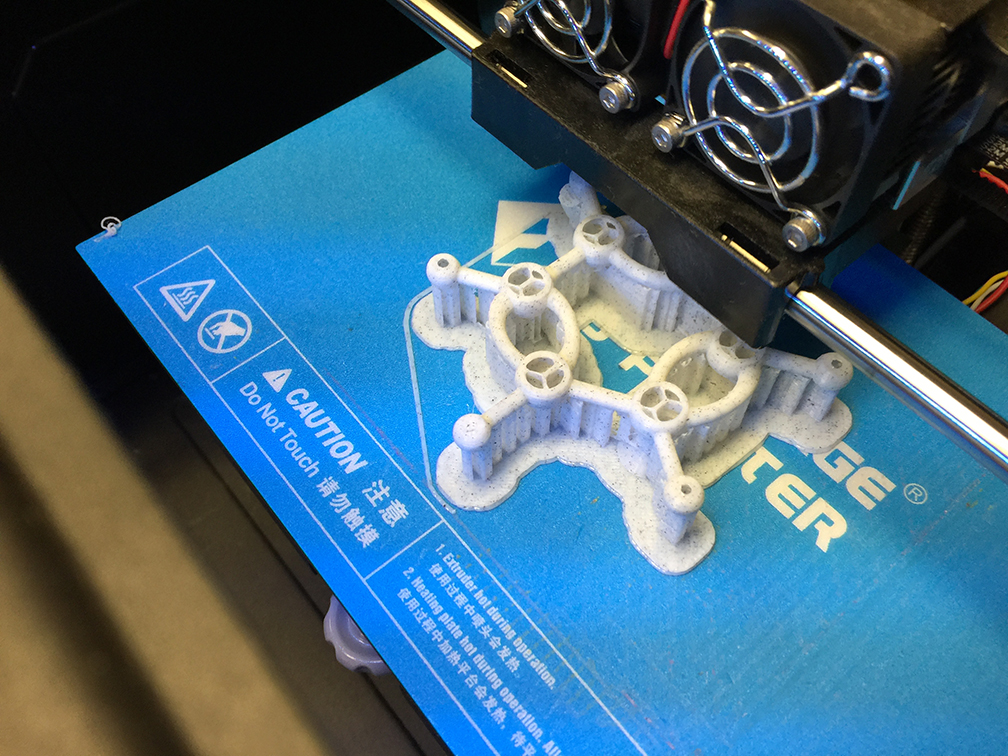
Once a 3D model is completed it is saved as an .OBJ or .STL file, then imported into a 3D printer’s slicing software which provides the G-code directions for moving the print nozzle across the build plane while extruding the melted filament. Where overhangs occur, supports must be built in (which can be done automatically or by hand). Once the model begins to print, it can take several hours to complete a moderately large print. The print must then be removed from the build plate and the raft and supports snapped off and sanded.

The benzene molecule, shown above in TinkerCAD, now printing out on my 3D printer.

Subject Integration and Adoption of 3D Modeling and Printing in Schools

Reyna’s 2018 literature review concluded that most previous research in learner-generated digital media lacks theoretical frameworks or solid pedagogy. This agrees with the TPACK model of technology integration (Rodgers, 2018), where the affordances and workflow of the technology, the appropriate pedagogy for teaching, and how students learn the content knowledge through the technology or medium must be considered to successfully integrate technology into the classroom. By using a constructivist/constructionist framework and the pedagogy of project-based learning and by training students how to create the media as they develop their own science-related content, we are following the TPACK model.

For 3D modeling, we cannot assume that even digital natives know how to use the conventions of modeling in three-dimensional space on a two-dimensional surface. It is a challenging innovation to learn, and many problems can occur in the modeling and printing process. Students do not naturally know how to subdivide polygons, use Boolean commands to cut holes, create procedural UV texture maps, create the lighting and atmospherics needed for a scene, or set up a 3D object for a successful print. This is highly technical work, and requires practice and scaffolding with simpler projects before large-scale media projects can be undertaken. Time must be set aside for training and practice either in class or using a flipped classroom model. The purpose of the 3D modeling – to learn a science concept – must be carefully considered and needs to be worth the time and effort and cannot be adequately taught through any other medium.

For adopting new technology, there is always a balance of risk and certainty. Some people and organizations are willing to accept risk to stay ahead of the curve, others, such as most schools, are risk-averse and will not adopt new technology until it has been widely accepted. This puts them behind the curve as laggards or late adopters.

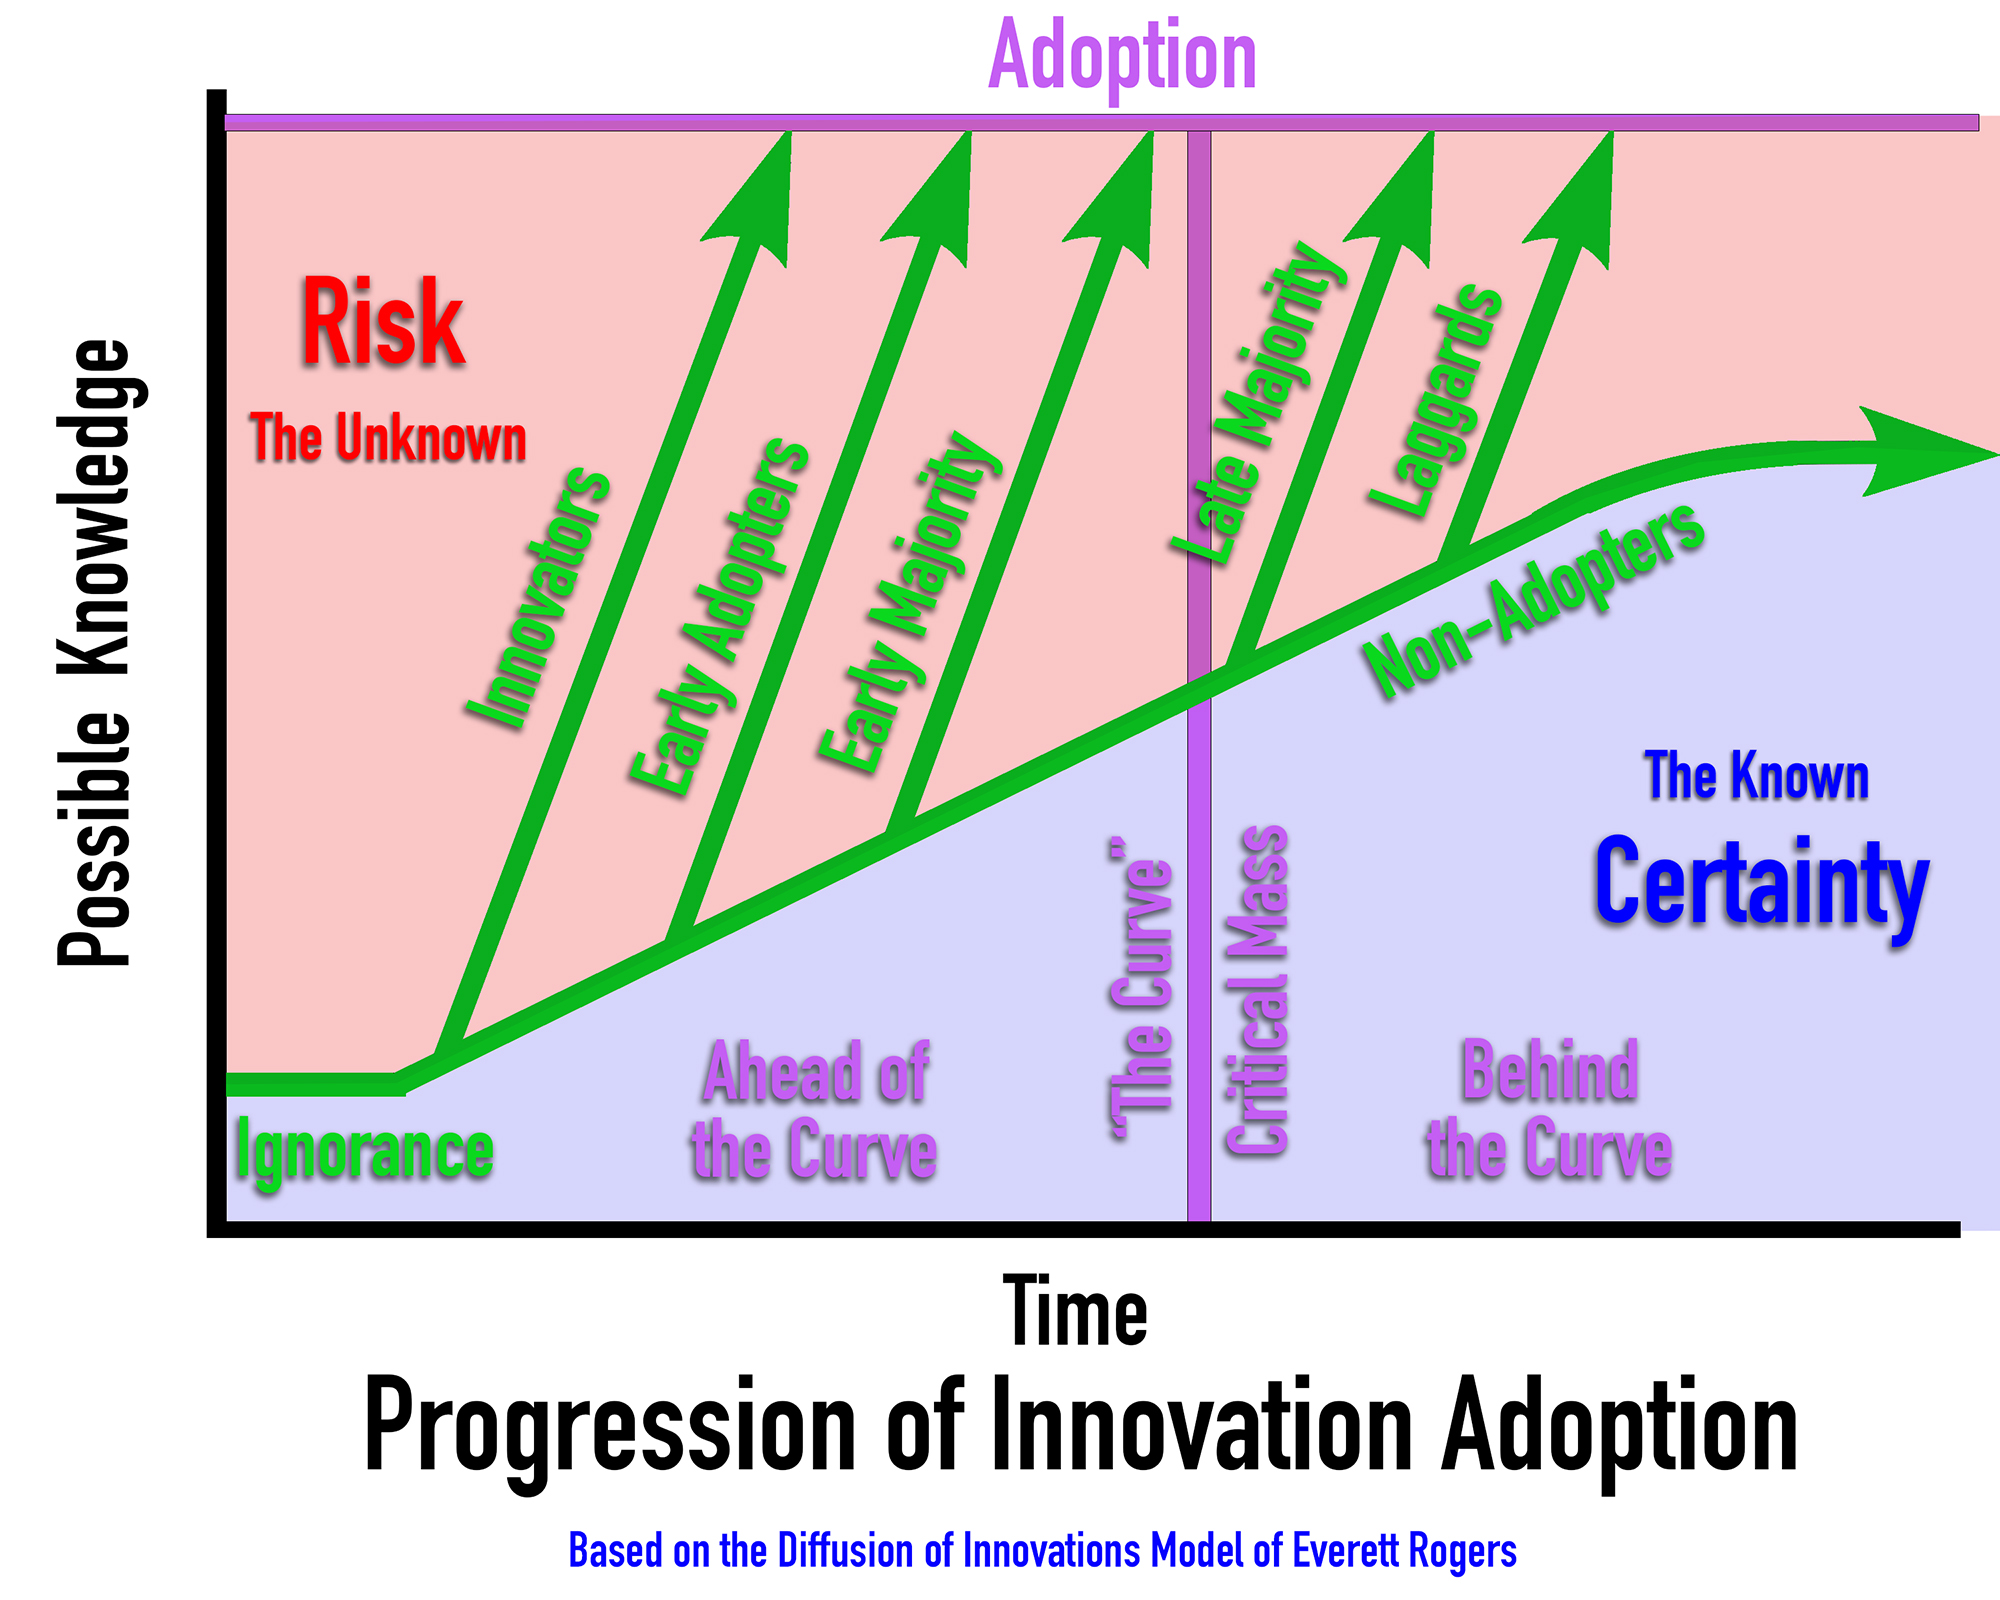
Because of these challenges, 3D modeling and printing have been slow technologies to truly take hold in schools. Although 3D printers are popular now, most schools and teachers have little idea how to use them effectively. If we use Everett Roger’s model of technology adoption (Legris, Ingham, & Collerette, 2003), schools are usually in the late adopter or laggard phase for adopting 3D technologies. They do not want to waste the time or dollars to invest in a 3D printer just because it is the newest shiny thing. Some individual teachers may be ahead of the curve and ready to adopt, but they will need to learn how to use 3D technologies on their own; there is little to no professional development training available through school districts unless provided by teacher associations.

Using 3D Modeling and Printing in Science Classes

Because of the time and challenge required to do 3D modeling, printing, and animation there should be a compelling reason for using this medium in a science classroom; the 3D model or animation must convey a scientific concept more effectively than other forms of media. Some possible applications include modeling and animating scientific processes or principles, modeling complex authentic data where it cannot be visualized in any other way, and creating accurate models of science-related objects that can be examined.

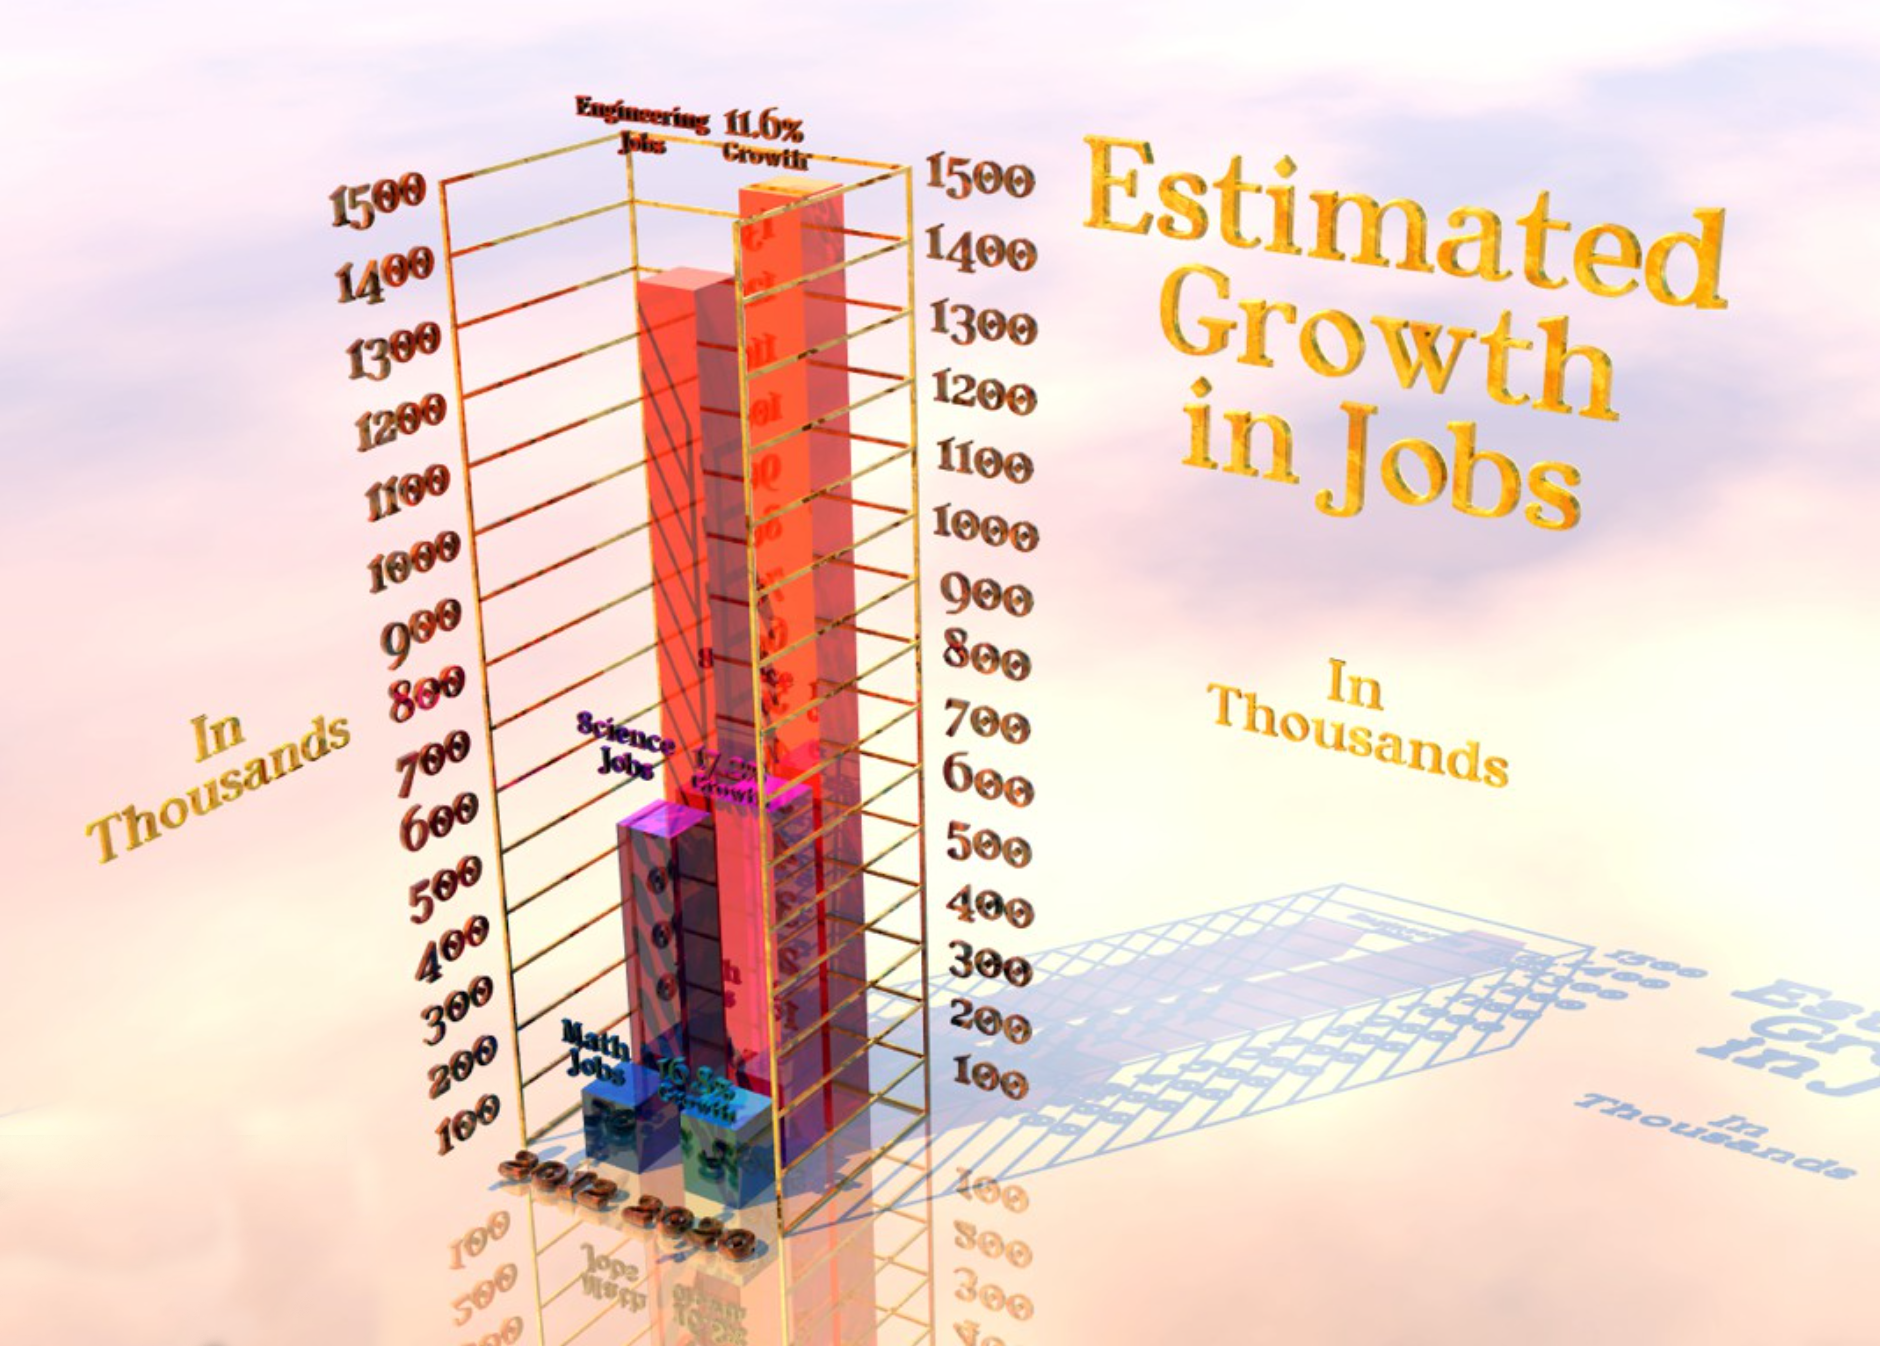
To demonstrate how data can be visualized in 3D, my chemistry students this week studied electrochemistry by comparing the voltages of different combinations of metal electrodes, recording the data in a two-dimensional grid separated by commas. We used a free program from the National Institutes of Health called ImageJ to convert the raw numbers into a grayscale image, with higher values represented as lighter shades of gray and lower numbers as darker shades. This image can be converted into a 3D object by Adobe Photoshop. Finally, an altitude sensitive texture is applied and text added and the scene rendered as an image or animation. Patterns in the data that are difficult to notice as raw numbers become readily apparent as a visual image. Students can easily see that magnesium is the most reactive metal and has the highest voltages. 3D visualization has great advantages over trying to understand a grid of numbers.

The SOFIA airplane, as modeled by my 6th grade Creative Computing Class.

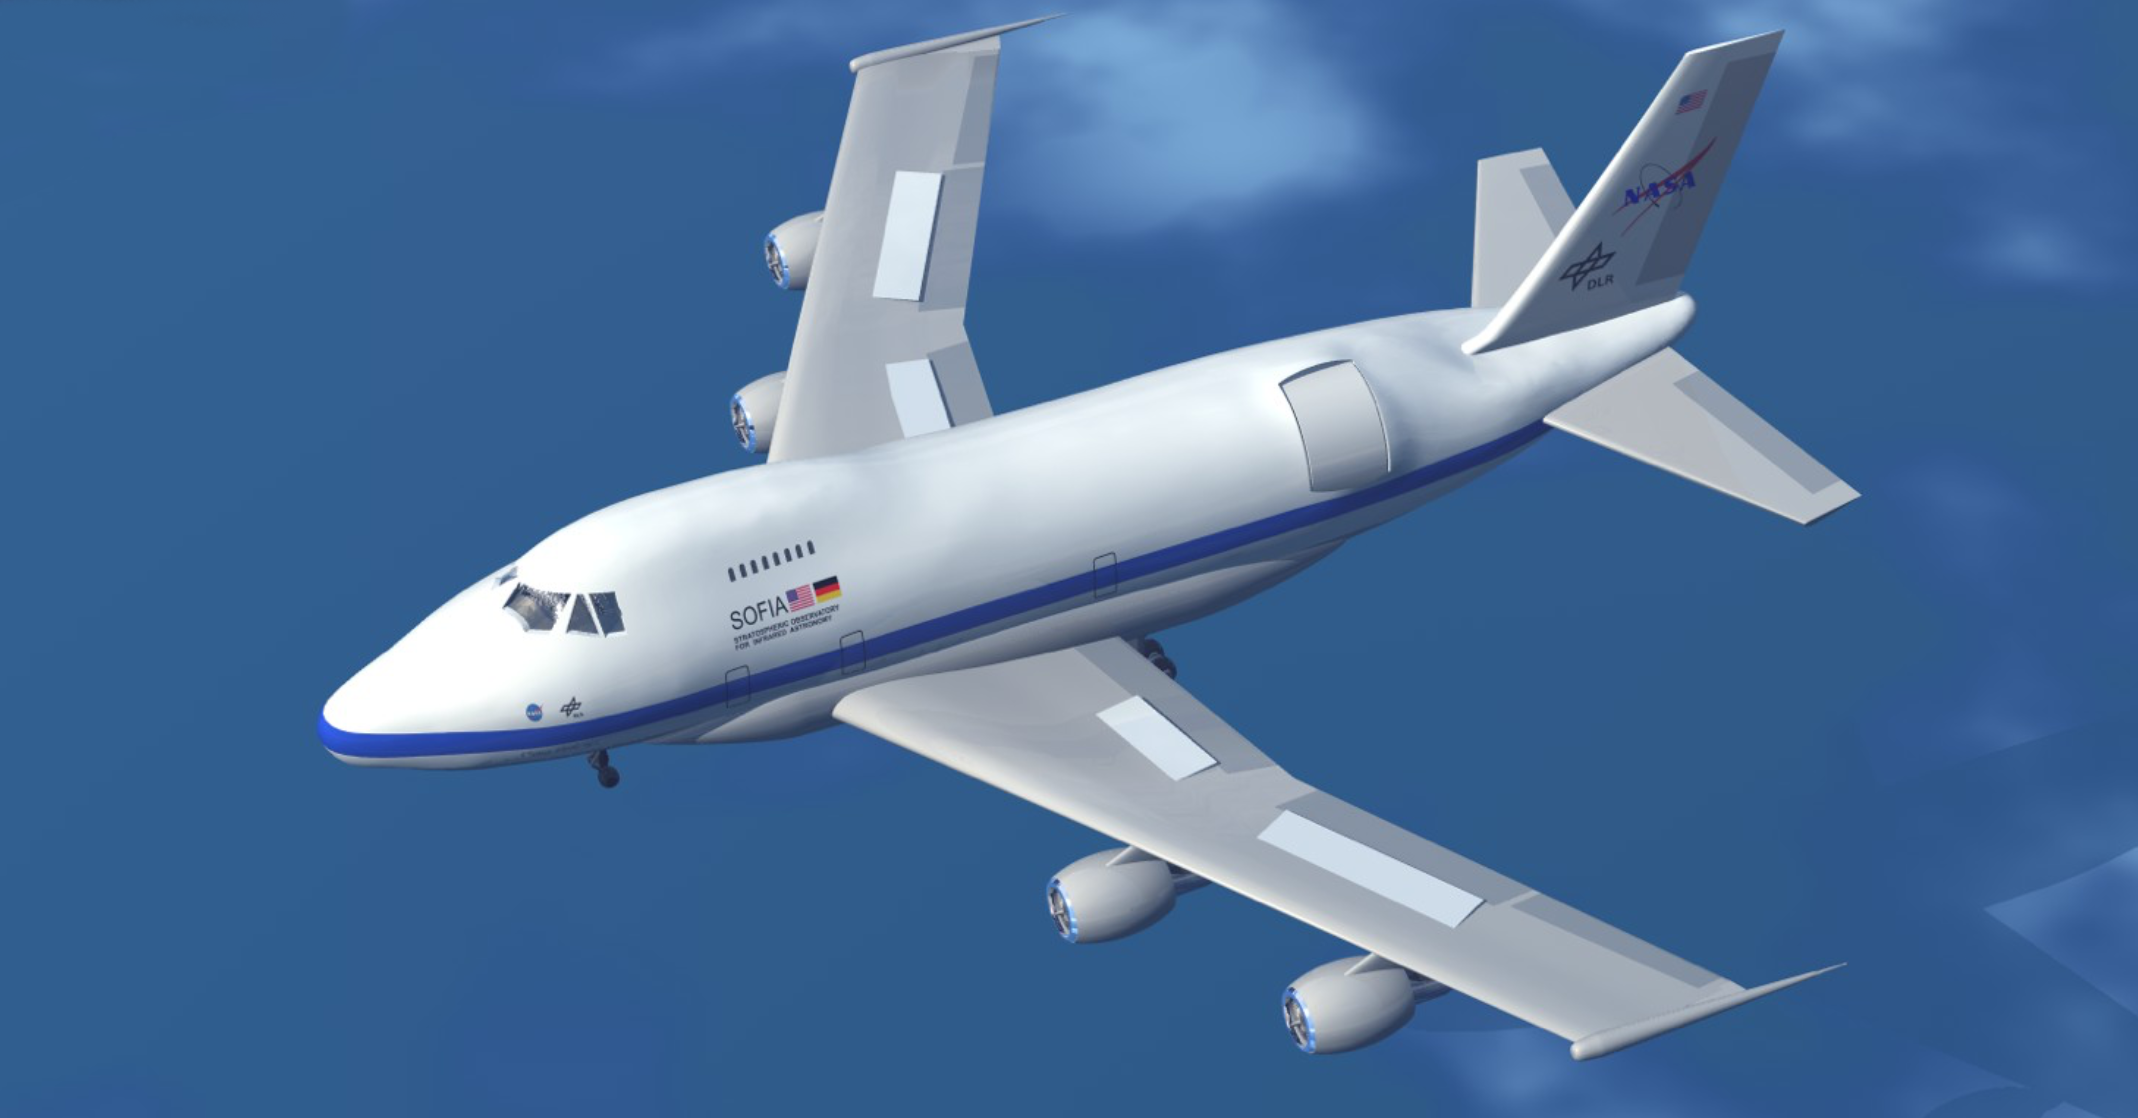
As an example of building models to illustrate concepts and objects, in 2004, my media design students began work on a video documentary for KUED, Salt Lake City’s PBS station, on the history of AM radio in Utah. They created animations of transistor radios as part of the title sequences of each segment based on photographs of actual radios. They modeled interfaces for an interactive DVD of our final video and for an accompanying CD-ROM programmed with Macromedia Director. Students in my 6th grade Creative Computing class each modeled a part of the SOFIA aircraft, or Stratospheric Observatory For Infrared Astronomy, and my high school students assembled, textured, and animated the final model. It was used to demonstrate how the telescope works for a video we made about my flight on SOFIA in 2013.

A diner modeled for the AM to FM project. The animation zoomed in on the jukebox, which acted as an interface for the history of AM radio.

My media design students created models and animations of Mars space probes for an interactive CD-ROM on Mars Exploration which they presented at a student symposium at Arizona State University. They learned how to access and model 3D terrain data of Mars from the MOLA instrument on the Mars Global Surveyor probe to analyze possible landing sites on Mars which we then printed out using color-changing PLA filament. Other students collaborated with the NASA Lunar Science Institute to study selenographic features and create a 3D animation of the Big Impact Theory of lunar formation.

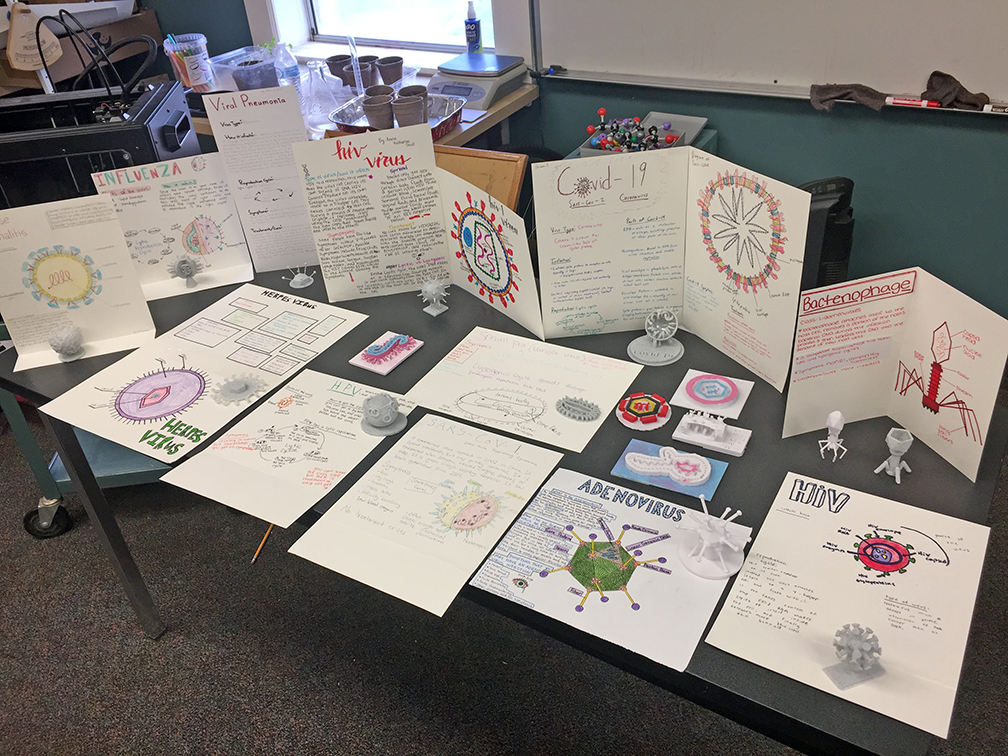
My biology students use TinkerCAD or SculptGL to model and print viruses for a unit on microbiology. To visualize the periodic properties of the elements, my chemistry students create a grid of data points and convert it to 3D models using ImageJ and Photoshop. My eighth grade physical science students created a 3D animated video with greenscreen narration showing a possible habitat that astronauts can live in on their way to Mars. To represent land forms on Earth, my students access EarthExplorer by the United States Geological Survey (https://earthexplorer.usgs.gov/), which allows grayscale heightmaps from the Shuttle Radar Topography Mission to be downloaded and converted into highly accurate 3D models.

A viral mini-museum. My biology students recently chose a virus, then modeled and printed it in 3D and created a display poster on its infection vector, parts, symptoms, and treatment.

All of these examples took time to learn and execute, so we needed to have compelling reasons for using 3D modeling that were worth the opportunity cost of time and the steep learning curve. In each case, using 3D enabled us to present authentic data more completely and helped us visualize important scientific concepts more effectively than other types of media.

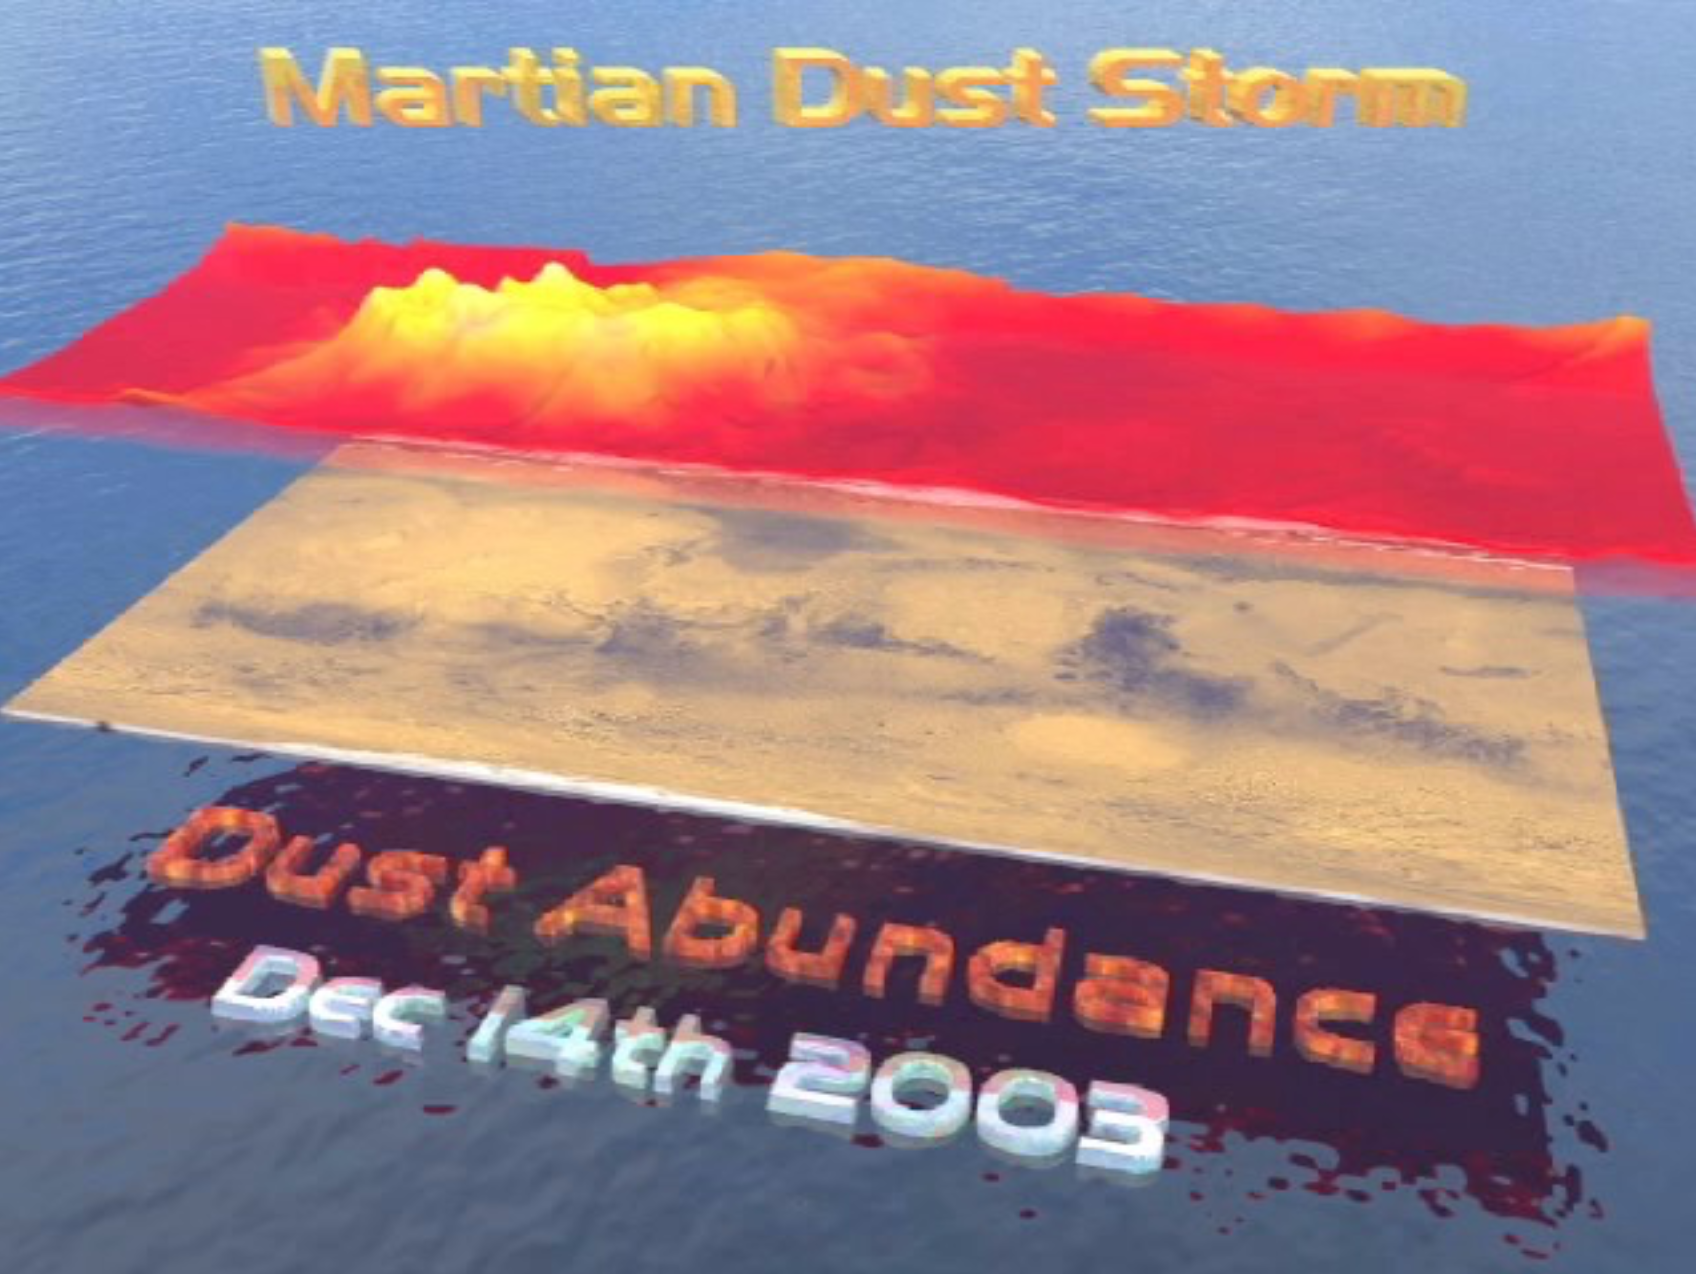
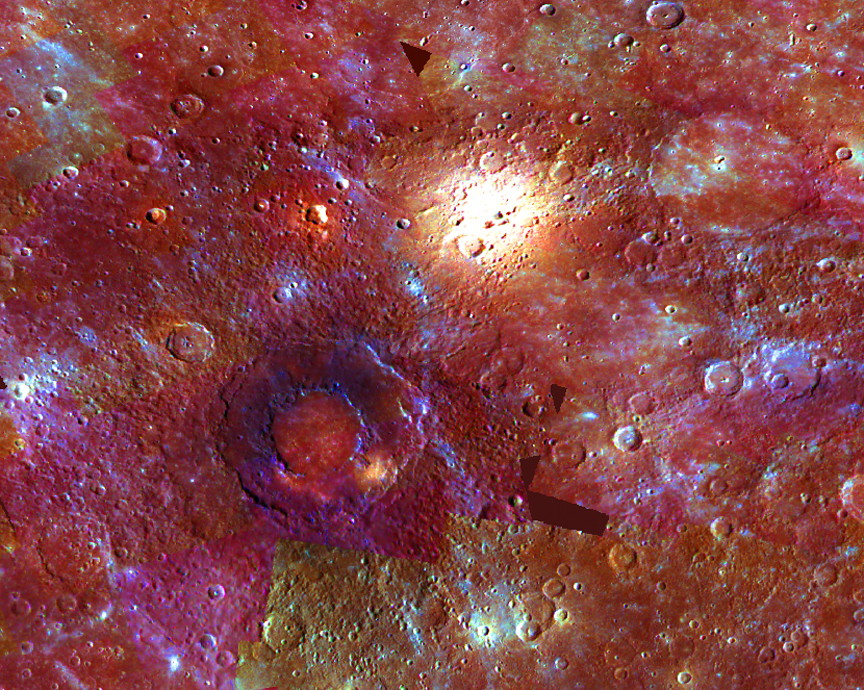
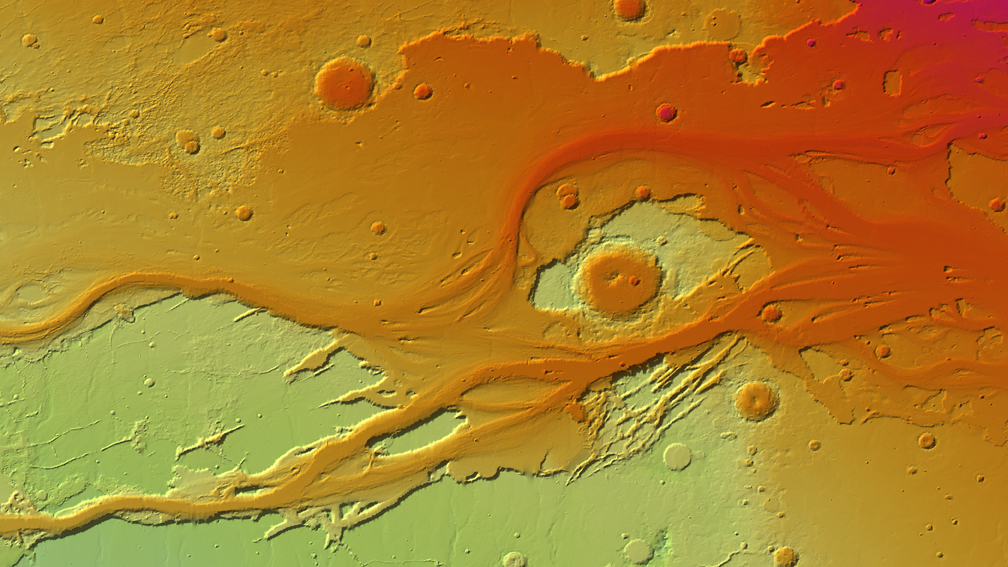
Using 3D modeling has benefits for students. Visualization of big data sets has become a growth career, as has 3D printing of everything from prosthetic limbs to cars to rocket parts. It allows for rapid prototyping and has become a necessary component for engineers. My students have used these techniques to create visuals for winning science fair projects, such as this one that determined whether surface features on Mercury were caused by impacts or volcanism. As part of the Mars Exploration Student Data Team program, my media design students downloaded Mars dust opacity data from December 2003 to January 2004 and converted it into animations showing how a dust storm arose over the Tharsis Plateau, blew across the equator, and spread globally just as the Mars Exploration Rovers were approaching. My current physics students are using altitude data from the Lunar Reconnaissance Orbiter’s LOLA instrument, turning grayscale heightmaps of the Moon into 3D models, then mapping spectroscopic data from Moon Mineralogical Mapper instrument to show where different commercially viable minerals might be located according to surface landmarks as shown here (Fa & Jin, 2007). They are creating a poster of their results for the ExMASS program to compete with students from nine other schools.

The alchemist in his lab. As part of a project to teach students chemistry lab equipment, I had them create their own versions of florence flasks, and other equipment, new and ancient, as well as models of various minerals. We put these together into this scene for fun.

Conclusion

In this paper I have described many 3D modeling and animation projects created by my students. They have learned many positive things about STEAM careers and processes along the way, but of most importance, they learned science concepts more deeply through 3D modeling than through any other method. Although 3D modeling can be rewarding in its own right, it has additional benefits for students including teaching marketable skills and providing them with opportunities to collaborate, communicate, solve problems, and enhance their creativity. Given our limited time as teachers and the high opportunity cost, we have to be very sure that 3D modeling also enhances science learning in ways that other options can’t achieve. In my own experience, the projects are well worth their time. Other teachers will have to look at their own situations and determine whether or not it is worth investing the time to learn and use 3D modeling in their own science classrooms.

Thanks for reading this. I hope it provided some ideas into how and why to use 3D modeling and printing in your science classroom.

References

3Dsourced.com (2019). Fused deposition modeling: Everything you need to know about FDM 3D printing. Retrieved 3/18/21 from: https://www.3dsourced.com/guides/fused-deposition-modeling-fdm/.

Art of computer animation (n.d.). Retrieved from: https://youtu.be/5xwLFRdewgE.

Brau, B. (2020) Constructivism. In R. Kimmons & S. Caskurlu (Eds.), The Students’ Guide to Learning Design and Research, EdTech Books. https://edtechbooks.org/studentguide/constructivism.

Clark, R. E. (1994). Media will never influence learning. Educational Technology Research and Development, 42(2), 21-29.

Center for Educational Innovation, (n.d.). Constructivism. Center for Educational Innovation, University of Buffalo. Retrieved from: http://www.buffalo.edu/ubcei/enhance/learning/constructivism.html

Edutechwiki,(n.d.). The media debate. Retrieved 4/18/21 from: http://edutechwiki.unige.ch/en/The_media_debate

Fa, W. & Jin, Y. (2007). Quantitative estimation of helium-3 spatial distribution in the lunar regolith layer. Icarus, 190 (2007), 15-23.

Goldberg, D. (2018). History of 3D printing: It’s older than you are (that is, if you’re under 30). Retrieved 4/18/21 from: https://redshift.autodesk.com/history-of-3d-printing/

Hoban, G., Nielsen, W., & Shepherd, A. (2013). Explaining and communicating science using student- created blended media. Teaching Science, 59(1), 33-35.

Kalantzis, M. & Cope, B. (2012). Literacies. Cambridge University Press: New York, NY

Kozma, R. B. (1994), The Influence of Media on Learning: The Debate Continues, School Library Media Research, Volume 22, Number 4, Summer 1994.

Krum, R. (2013). Infographics: Effective communication with data visualization and design. John Wiley & Sons: Hoboken, NJ.

Legris, P., Ingham, J. & Collerette, P. (2003). Why do people use information technology? A critical review of the technology acceptance model. Information & Management, 40 (2003), 191-24.

McLuhan, M. (1962). The Gutenberg galaxy: The making of typographic man. University of Toronto Press: Toronto, Canada.

Orus, et al. (2016). The effects of learner-generated videos for YouTube on learning outcomes and satisfaction. Computers & Education, 95 (2016), 254-269.

Reyna, J. (2021). Digital media assignments in undergraduate science education: An evidence-based approach. Research in Learning Technology, 29 (2021), 1-19.

Reyna, J. & Meier, P. (2018). Learner-generated digital media (LGDM) as an assessment tool in tertiary science education: A review of literature. IAFOR Journal of Education, 6(3), 93-109.

Rodgers, D. (2018). The TPACK framework explained (with classroom examples). SchoolologyExchange. Retrieved from: https://www.schoology.com/blog/tpack-framework- explained.

Spencer, J. (2021). PBL for all. Retrieved from: https://spencerauthor.com/pbl-for-all/

A still from an animation showing a dust storm on Mars forming above the Tharsis Plateau in December, 2003 just as the Mars Exploration Rovers were approaching. The data from for this animation was downloaded from the atmosphere opacity measurements of the Mars Global Surveyor space probe.

Read Full Post »

Starting out at a new school, I decided it was time to re-examine my personal philosophy of teaching and education.

Over the last several years, as I have been reporting my experiences in these blogs, I have paid attention to how effective I am as a teacher and what sorts of activities and lessons seem to resonate with students and provide memorable learning opportunities for them. From this I have developed my own model of education, which I have shared at conferences and workshop sessions. I will be starting a Doctorate of Education (EdD) program this fall at the University of Northern Colorado, specializing in Innovation and Education Reform. This will be a means for backing my theories up with empirical research, not just the anecdotal evidence I have now. I already know what I want to do for my doctoral thesis.

This is my revised model so far, with examples from my teaching experiences:

Creative Classroom Diagram v3-s

This is my revised model of education, what could also be called the Levels of Engagement model. The purpose of education, in my experience, is to move students from ignorance (no knowledge of a subject) through passive learning (sitting and watching or listening) to active learning (hands-on, experiential) and beyond to creative learning (students as explorers, teachers, and innovators). Students move from being consumers of educational content to interacting with content to creating new educational content or new science, engineering, art, math, or technology. The students become makers, designers, programmers, engineers, scientists, artists, and problem solvers.

I call this the Creative Classroom model, as the goal is to move students from Ignorance (lack of knowledge or experience with a subject) through the stages of being a Passive Learner (sitting and listening to the teacher or a video and consuming content) through being an Active Learner (students interacting with content through cookbook style labs) to becoming a Creative Learner (students creating new content as innovators: teachers, makers, programmers, designers, engineers, and scientists). Let’s look at these levels in more detail. It could also be titled the Levels of Engagement model, as moving to the right in my model signifies deeper student engagement with their learning.

Level 0: Ignorance

Ignorance is the state of not having basic knowledge of a subject. This isn’t a bad thing, as we all start out in this state, as long as we recognize our ignorance and do something about it. What our society needs are more creative and innovative people, not people who are passive or even willfully ignorant.

Ignorance is not bliss. What a person doesn’t know may indeed hurt him or her – if, for example, you don’t know that mixing bleach with ammonia will produce chlorine gas, you could wind up with severe respiratory problems. A basic literacy for science and engineering concepts is necessary for any informed citizen, since we live in a technological age with problems that need solving and can only be solved through science and technology.

If you do not understand science and technology, you can be controlled by those who do. How many people actually understand the technology behind the cell phones they use every day? They leave themselves vulnerable to control by the telecom companies that do understand and control this technology. If you don’t understand the importance of Internet privacy and share personal information on a website or Facebook page, you leave yourself vulnerable to people or corporations that can track your web searches or even stalk you online (or worse). I am fairly ignorant of the basic techniques for repairing my car. This leaves me vulnerable to paying the high prices (and the possible poor service) of a local mechanic, when I could save lots of money and ensure quality if I only knew how to do it myself.

As teachers our first responsibility is to lead students away from a state of ignorance. This seems simple enough, but anyone who teachers teenagers (and even some so-called adults) will know that some of them insist on remaining willfully ignorant, usually because they mistakenly think that they already know everything they need to know, which is never true of anyone. As the Tao Te Ching says: “To know what you know, and what you do not know, is the foundation of true wisdom.” So the first step to becoming a creative learner is to delineate, define, and accept our areas of ignorance.

Most Likely to Succeed quote

A quote from the introduction of “Most Likely to Succeed” by Toni Wagner and Ted Dintersmith. How long will it take before education systems realize that the old factory model of education is no longer working?

Level 1: Passive Learning

When people start learning a subject they are usually not sufficiently self-motivated to learn it on their own – but we hope they will reach that point eventually. Most inexperienced learners are passive. They wait for their teachers to lead the lesson, sitting in their seats listening to lectures or watching a movie or otherwise absorbing and consuming educational content. The focus in such classes is to complete individual assignments that usually involve only lower order thinking skills such as recall and identification. This is the level described in the quote above from Most Likely to Succeed by Toni Wagner and Ted Dintersmith.

At this level, teachers emphasize mastering the facts and basic concepts of a subject. Students are consumers of educational content, but do not interact with it or create new content. Common classroom activities include listening to lectures and taking notes or answering basic questions, watching a video or demonstration, completing worksheets, or reading a text. Student motivation is usually external, based on the desires of parents or teachers and the fear of negative consequences (poor grades, etc.).

Education at this level is all about efficiency but isn’t very effective, since less than 10% of what teachers share in lectures is retained by students beyond the next test. Evaluation is based on standards, not skills. There is always a need for students to learn facts and concepts, but it is better to provide engaging projects where the students will find out the facts on their own as a natural part of completing the project.

Level 2: Active Learning

At this phase, students start developing internal motivation as they engage and interact with content. Students are beginning to explore, but usually through activities that are fairly structured although more student centered than before. These activities are hands-on; students are doing and acting, not sitting and listening.

Common classroom activities would be “cook-book” style labs, with step-by-step instructions and pre-determined outcomes. Students begin to learn observation and inquiry skills, with some data collection in a controlled environment along with data analysis. Teachers still determine if the student has the “right” answer. They start to practice the 21st Century skills of collaboration, communication, and critical thinking. Unfortunately, most science classes stop at this level without moving beyond hands-on to the deepest level.

reasons for using inquiry

Inquiry-based learning shares many of the features of project or problem-based learning, in that it is student centered and empowers student voice and choice, allows a high level of engagement and meaningfulness as students take responsibility and ownership for their learning, and teaches resilience, grit, and perseverance.

Level 3: Creative and Innovative Learning

If the purpose of STEAM education is to teach students how to become scientists, technology experts, engineers, artists, and mathematicians then they must learn the final stages of inquiry: to ask and answer questions, to solve problems, or to design products. The purpose of science is to answer questions whereas engineering has the goal of solving problems through designing and testing prototypes. Both are creative endeavors as the result of learning is something new for society – new knowledge or new products.

In the Creative Classroom, the environment is completely open, without predigested data or predetermined conclusions. Students work on projects where they research a question important to them, develop a methodology, decide how to control variables, make observations, determine methods of analysis, and draw and communicate conclusions. At this level, students become innovators or inventors. They synthesize knowledge and apply it to themselves and teach others through writing blog posts, creating posters or infographics, presenting lessons and demonstrations, and filming and editing videos or other educational media. They become makers and programmers, building products of their own design. The students are creating and contributing to society by making new content, knowledge, and solutions.

Learning at this level is never forgotten but is difficult to evaluate with a multiple-choice test, as the focus is on skill mastery and competency instead of easily regurgitated facts. Overall, this deepest (and most fulfilling, motivational, and engaging) level is entirely student centered and driven, with instructors as mentors. Ultimately, once a student has practiced learning at this level, the teacher is no longer necessary; the students will continue to learn on their own, because they are now entirely internally motivated. These are the people that society will always need.

How This Impacts My Teaching:

As an educator, my goal is to move students toward Level 3 activities and projects. Where I succeed, the projects my students work on are meaningful to them, demand professional excellence, use authentic data, involve real-world applications, are open-ended, and are student-driven. The students are required to create, make, program, build, test, question, teach, and design. They are innovators and engineers; they are creative students.

To give some examples from previous blog posts on my two sites:

Rachmaninoff 430-630-1000-s

Representative color image of the Rachmaninoff Basin area of Mercury, created by my students using narrow band image data from the MESSENGER space probe at 430, 630, and 1000 nm. We stretched the color saturation and image contrast so that we could see differences between volcanic (yellow-orange) and impact (blue-violet) features.

My chemistry and STEAM students created an inquiry lab to study the variables involved in dyeing cloth, including the history, ancient processes, types of cloth, mordants (binders), types of dyes, and other factors. We also explored tie dyeing, ice dyeing, and batik and developed a collection of dyed swatches that we will turn into a school quilt. We also experimented with dyeing yarn with cochineal, indigo, rabbit brush, sandalwood, logwood, etc. and my wife crocheted a sweater from it.

2. My chemistry and STEAM students did a similar inquiry lab to test the variables involved in making iron-gall ink using modern equivalents. We studied the history and artistry of this type of ink (used by Sir Isaac Newton, Leonardo DaVinci, and many more) and tried to determine the ideal formula for making the blackest possible ink. We also created our own watercolor and ink pigments such as Prussian blue, etc. We used the inks/watercolors to make drawings and paintings of the history of chemistry.

3. My astronomy students used accurate data to build a 3D model of the nearby stars out to 13 light years. This lesson was featured in an article in The Science Teacher magazine, including a video of me describing the process.

4. My astronomy students created a video for the MIT BLOSSOMS project showing a lesson plan on how to measure the distance to nearby stars using trigonometric parallax. It is on the BLOSSOMS website and has been translated into Malay, Chinese, and other languages.

5. My earth science students learned how to use Mars MOLA 3D altitude data to create and print out 3D terrains of Mars.

6. My chemistry students created a 12-minute documentary (chocumentary?) on the history and process of making chocolate.

7. My 6th grade Creative Computing class built and animated a 3D model of the SOFIA aircraft prior to my flying on her as an Airborne Astronomy Ambassador.

Kasei_Valles-Mars-2

A 3D render of the Kasei Valles area of Mars, created by students as part of the Mars Exploration Student Data Team project. They learned how to download Mars MOLA data from the NASA PDS website and convert it into 3D models and animations, then created an interactive program on Mars Exploration which they presented at a student symposium at Arizona State University.

8. My science research class collected soil samples from the mining town of Eureka, Utah to see if a Superfund project had truly cleaned up the lead contamination in the soil.

9. My chemistry and media design students toured Novatek in south Provo, Utah and learned about the history and current process for making synthetic diamond drill bits. Another group videotaped a tour of a bronze casting foundry, while others took tours of a glass blowing workshop, a beryllium refinery, and a cement plant.

10. My astronomy students used infrared data from the WISE and Spitzer missions to determine if certain K-giant stars may be consuming their own planets. This was done as part of the NITARP program. They developed a poster of their findings and presented it at the American Astronomical Society conference in 2015 in Seattle.

11. My biology students build working models of the circulatory system, the lungs, the arm, and create stop motion animations of mitosis and meiosis. As I write this, they are learning the engineering design cycle by acting as biomechanical engineers to design and build artificial hands that must have fingers that move independently, an opposable thumb, can pick up small objects, make hand gestures, and grasp and pick up cups with varying amounts of water in them.

12. My computer science students, in order to learn the logic of game design, had to invent their own board games and build a prototype game board and pieces, write up the rules, and have the other teams play the game and make suggestions, then they made revisions. This was an application of the engineering design cycle.

13. My STEAM students designed and built a model of a future Mars colony using repurposed materials (junk), including space port, communications systems, agriculture and air recycling, power production, manufacturing, transportation, and living quarters. They presented this and other Mars related projects at the NASA Lunar and Planetary Science Conference in Houston.

These are just a small sampling of all the projects my students have done over the years. I have reported at greater length in this blog about these and other projects. My intent has always been to move students away from passive learning to active learning to inquiry/innovation. They often create models, build prototypes, collect data, or design a product and it is always open ended and student centered; even if I choose the topic of the project, they have a great deal of freedom to determine their approach and direction. There is never one right answer or a set “cookbook” series of steps, nor a focus on memorizing facts. They learn the facts they need as a natural consequence of learning about their project topics; by completing the project, they automatically demonstrate the required knowledge.

Mars Exploration main interface-s

My students designed, animated, and programmed this interface for their Mars Exploration project, then presented it at a student symposium at Arizona State University as part of the Mars Exploration Student Data Team program. They build 3D models and animations of Mars probes, such as the one of the MER rovers shown. In this interface, the Mars globe spins, and as the main buttons are rolled over, side menus slide out and space probes rotate in the window.

Some groups require considerable training and experience to get to this level of self-motivation and innovation, and some team building, communication, and creativity training may be required. Other groups move along more rapidly and have the motivation to jump right in. This means that managing such projects as a teacher can be challenging because every team is different. I find myself moving from being a teacher at the center of the classroom (a sage on a stage) where all students move along in a lock-step fashion to becoming a mentor or facilitator of learning (a guide on the side) as students move toward higher levels of engagement at their own pace and in their own way.

As classroom activities become more student-centered, I find it natural to tie in the Next Generation Science Standards. If I do an inquiry lab to test the variables that affect dyeing cloth, the answer is not known before nor the methodology. Students have to work out the scientific method or steps needed by asking the right questions and determining how to find the answers, or to design, build, and test a prototype product. Through this method they learn the science and engineering processes that are one dimension of the 3D standards.

Crosscutting concepts can also be explored more effectively through this method. Inquiry leads to observations, which should show patterns, processes, models, scale, proportion, and other such concepts, which are the second dimension of 3D science education.

This leaves the third dimension, which is to teach subject Core Concepts. This is where most of the misguided opposition to Project Based Learning comes from. Teachers feel that projects somehow take time away from “covering” all the standards. But if we want deep learning of the core concepts of a subject, we can’t expect students to learn them by using surface level teaching techniques that emphasize facts without going any deeper. If I do it right, I can involve many standards at once in the same project and not only meet but exceed the standards in all cases. I call this “standards overreach” and I will talk about this in more detail in my next post.

Element posters and virus models

Projects don’t have to be a elaborate and complex as the Mars project shown above. Here, my New HAven students have created models of viruses and mini-posters of chemical elements. The green plastic bottle to the left is a model of a human lung.

Read Full Post »

Borneo Day 6: Wednesday, July 26

Physics class

The physics class at SMAN 1 Mandastana. I gave all the students a MAVEN postcard. I taught two astronomy activities on this day. The teacher is standing next to me with the NASA sticker.

Today Craig and I taught lessons in our subject areas. He taught the spaghetti tower engineering project and the DaVinci helicopter activity. I taught two astronomy lessons: the human orrery and the parallax activity.

Martapura River at dawn

The Martapura River at dawn, taken from the entrance to our hotel.

We had worked out what we would be teaching with the physics teacher the day before. When we first met the teachers on Monday, I noticed that she was the only female teacher not wearing a hijab, for whatever reason, and that she didn’t seem as carried away in the general hoopla about having us here. I could see that I needed to convince her that this would be a good experience for her students, so I asked Nazar if we could meet with her and discuss what we wanted to do. She warmed to the idea of teaching engineering and astronomy, and that we would trade off with another class so that both would get the lessons. We decided on the details and were good to go.

Laying down planets

Laying out the planet rings for the human orrery activity.

I set up in her classroom this morning, preparing the materials I had brought with me all the way from America in my blue suitcase. I had the string orbits and space probe for the orrery and the materials for making sextants. I also had my final presents for students, the remaining NASA stickers, postcards, and bookmarks. My suitcase will be much lighter after today.

As the first class started, I introduced the idea of the planets and how they were called the Wanderers by the Greeks. I asked them for the Indonesian words: Earth is Bumi and the other planets are essentially the same words as English and Latin. Then I asked for the name of the sun and this one surprised me: it is Mata Hari. I asked if it was the same name as the infamous World War I spy that lived in Paris, and they said yes. She was a Dutch woman who had lived in Indonesia with her husband and studied dance here when her marriage fell apart. She took the name of the Sun as her stage name.

Space ship arrives at Mars

The spaceship arrives at Mars after a six month journey. Now it has to wait there until Earth comes back around, and then a six month return voyage. We simulated all of this through our human orrery.

I described how Ptolemy worked out the motions of the solar system based on a geocentric model with deferent and epicycle circles like a spirograph. They understood the translations given by Nazar, but no one has seen a spirograph before. No matter. I plunged onward. I explained that Ptolemy had been brilliant but wrong, and that Arabic astronomers had gotten better observations and that Copernicus created a heliocentric model based on them. I certainly put Nazar to the test. I asked for volunteers to be the planets and Mata Hari, and then we went outside into the courtyard.

We laid out the string orbits in as circular a pattern as possible, then I ran the simulation calling out “Two weeks.” They certainly know what that means now. I pointed out how Mercury is fastest and Mars slowest. Then I showed how a space probe or human mission would take 6-8 months to reach Mars, starting when Earth is 90° from Mars and overtaking it, then arriving at Mars on the opposite side of the Sun. Astronauts would have to wait until Earth came back around to the same position before starting back, a 30 month round trip. At the end, I had students stand around the circles as zodiac constellations and demonstrated how retrograde motion works as Earth overtakes Mars.

Measuring stars

Students at SMAN 1 Mandastana measuring the angles from planets to stars in our parallax activity.

It was a hot activity out in the sun in the courtyard and we were all grateful to get back inside, even if the classroom isn’t air conditioned. I handed out Mars MAVEN postcards (I still had quite a stack) and the students insisted that I sign them as an autograph. That took a few minutes. Then we took photos again.

Mata Hari in 2010

Mata Hari in 2010. She was born from Dutch parents but moved with her husband to Indonesia, where she learned Javanese dancing. After divorcing and moving to France, she started a career as an exotic dancer and took her stage name from the Bahasa Indonesia word for sun, literally “eye in the sky.” She was accused of being a German spy and was executed in 1917 by the French.

After we traded classrooms, I was in a math teacher’s class and I taught a second astronomy lesson, this one a bit more challenging. This is the lesson I developed on how we calculate the distance to nearby stars using trigonometric parallax. I introduced the idea of using the tangent function to find the distance to the star based on the parallax angle created by the star’s apparent wiggling back and forth compared to the background stars because of the Earth’s revolution around the Sun. I had to ask the Indonesian word for star, which is bintang. There is a beer in Indonesia (popular on Bali but not so much elsewhere, because Muslims don’t drink alcohol) called Bintang or Star Beer.

Measuring stars 2

Helping students measure the angles to simulated stars in our parallax activity.

I divided the students into groups and handed out the wooden dowels, protractors, tape, string, and beads I had brought. The built the sextants, and then they drew up stars and planets on the cardstock with the markers I brought. Then we headed outside to the courtyard again. I used two meter sticks we had borrowed from the physics teacher (kept in the teacher’s lounge because they are very valuable and she doesn’t want them broken) and laid out and measured the planets on one line and the stars on another perpendicular line. I explained how to measure the angles with the sextants, and the math teacher helped her students figure out the process. The girls jumped in a lot more willingly than the boys (no surprise there), who were more willing to stand in as stars. Once we had at least two measurements from each planet to each star, even though not all groups had all measurements, we headed back inside as we were all getting heat stroke. I hadn’t thought of the problem with the heat, and the poor girls were roasting in their hijabs.

Measuring stars 3

Measuring the angles to stars from simulated planets using a sextant. It was a hot day, so once we got a few measures for each planet to each star, we headed back inside to do the calculations.

The students pulled out calculators (I hadn’t needed to bring the ones I had) and set to work on the tangent calculations once I had explained the formula. They seemed to all understand it, and had obviously worked with trig functions before. I drew up a table on the white board and we added their measurements, then their calculations. They results were exactly as expected, fitting the pattern much better than any class I’ve ever tried this with. The further out the planet, the better the results compared with the actual answers. The further out the star, the less accurate the results. We talked about why and how the tangent function reaches infinity the closer you get to 90°, so being off by even a degree for the further stars means great differences in the tangent function.

As you can imagine, this lesson took a bit longer than 90 minutes, but the teachers said to go ahead and continue because the students were really getting into it. I don’t know how many hands-on physics activities they normally do – I didn’t get to see the Fisika lab room or any equipment, but if they only have two worn out meter sticks, it can’t be that well equipped. Considering that astronomy isn’t regularly taught in high school, they seemed to have a pretty good grasp of basic astronomy, which leads me to think it is taught in junior high or elementary school. I saw some mechanical orreries in one of the elementary classrooms we visited in Jakarta, so it must be taught at some point.

Calculating answers

Students calculating the tangent function to find the distances to the simulated stars.

It was audacious of me to try to teach these lessons, which are hard to teach even in America. That they were so successful was beyond anything I could have hoped for. I saw some real comprehension in the students’ eyes; I actually taught them something new. I knew the language barrier would be a challenge, but Nazar’s English is good and we managed to communicate. It helped that I learned a few Indonesian words, enough to show my desire to reach them. The students reciprocated by listening and following instructions well, and they seemed to truly appreciate seeing how trigonometry really can be useful, or how simulations and kinesthetic activities can help to demonstrate science concepts.

Calculating star distances

Students calculating the distances to stars using the tangent function for the parallax activity. Their answers were the best I’ve ever seen in this activity, and showed the expected pattern that the more distant a planet, the more accurate the answer. The more distant the star, the less accurate the answer.

It also helped that science really is a universal language. Its concepts remain the same throughout the world; only the specific words change, but because many of them are based on Latin, they are fairly easy to understand and interpret across our two cultures. I have great gratitude to Nazar and the other English teacher for helping to translate the words, and to the science and math teachers for having already laid the foundation of math and science concepts. None of this would have worked otherwise.

Calculating star distances 2

Finding the distances to simulated stars using trigonometric parallax. These students at SMAN 1 Mandastana in Borneo did a great job with the parallax activity. It was a great honor to teach one of my own lesson plans here.

Craig’s engineering exercises also went well, although he did not see the level of creativity and divergent thinking one might expect of American students. Whether or not these types of activities will be used by the science teachers remains to be seen. One day of demonstration is not enough to overcome a lifetime of teaching habits. We won’t be here long enough to follow through, but at least we provided lessons that were unforgettable and truly lived up to our hype as master teachers.

Craig and David with teachers

Craig Hendrick and David Black with teachers at SMAN 1 Mandastana.

I don’t consider myself to be a great educator compared to many teachers I have met, but there are moments when I do well and this was one of them. As my message came through across barriers of culture and language, using concepts that are hard for even English native speakers to understand, I realized that I can be an excellent teacher, after all. We all rose to the challenge, partly because we dared to do what should have been impossible. At least at that moment, I felt deserving of the accolades and respect I have been shown here.

Physics class 2

The second class of the day. I did the parallax activity with them, and they did a fantastic job. I’ve decided that science is truly the universal language.

Read Full Post »

Nuremburg Chronicles Empedocles

Anaxagoras and Empedocles, from the Nuremburg Chronicles

In my last post, I showed the statistics of what this blog has accomplished so far. I feel very good about where we’ve been, but now it’s time to describe where I plan on going this coming year.

Given that I am not teaching chemistry this school year, my work on the Elements Unearthed project has slowed down a bit as my attention has been diverted elsewhere by the astrobiology projects (the podcasts and CLOE animations) and other projects that I’ll describe next week. I anticipate teaching chemistry again next year, and I am in the process of writing up a series of grant proposals (all of which have to be done by Feb. 1) that, if successful, will provide funds for purchasing some iPad tablets and probeware that will allow us to do some environmental field research.

fluorite and emerald

Fluorite and emerald crystals in the collection of Keith Proctor

In the meantime, I have a large backlog of videos that I have taped of various mine tours and interviews I’ve done across the country. I need to edit these into final videos and report on them in detail on this site. In order to keep myself on track, I’ve created a schedule for when I’d like to do each video and the topics I’ll cover here as I work on them.

This January, 2012, I am going to start at the beginning and look at ancient chemistry and our knowledge of the elements in prehistoric and early historic times. Then in February, I will start to work on my Greek Matter Theories videos. I have previously created all the script and narration and have even set up the video files and begun the graphics and animations. It’s high time I finished these. I’ll start with an overview of the Greek Ideal in philosophy and science, then talk about Thales and the Miletian School, then Parmenides and Zeno and the Eleatics. In March, I will talk about Heraclitus and Empedocles and the atomic theory and Plato. In April, I’ll move on to Aristotle, Epicurus, and the debate on elements versus atoms, ending in the theology of St. Thomas Aquinus and how atomic theory came down through the Middle Ages.

In May and June I’ll discuss the practical side of chemistry, with a look at ancient crafts, including metalworking, glass making, and other medieval technologies, including a detailed look at Agricola’s De Re Metallica (which I have many photos of).

Dalton molecules

Diagrams of molecules by John Dalton

By July I should have the funding I need in place to start the field research. My plan is to partner with another school, perhaps Tintic High School or Wendover High School, to travel out to nearby mining sites and use the probeware and iPads to collect and record data on soil and water environmental conditions, such as the pH of soil and runoff water near old mine dumps. I’m especially interested in seeing if the EPA efforts to mitigate contaminated soil in and around Eureka, Utah have been successful. I’ve talked about those efforts in previous posts (especially here: https://elementsunearthed.com/2010/06/09/the-legacy-of-the-tintic-mining-district/ ), so I won’t talk about them again now. We would use GPS coordinates and GoogleEarth to set up a grid of sample sites both in and out of the recovered area. We would sample the surface and two feet below ground. It would require several trips and coordination with local students to gather the data, but it is a project that would fit very nicely with the research I’ve already done. If I can get enough money together, I would like to rent a portable X-Ray Fluorescence Spectrometer which can read element abundances nondestructively on the site.

In preparation for all this, I need to make one more trip to the Tintic district in June to photograph and videotape the mines in the southwest area, which were the first mines discovered, including the Sunbeam and Diamond mines. One of my great grandfathers, Sidney Tanner Fullmer, died as a result of injuries suffered in an accident while working in the Diamond mine, leaving my grandmother an orphan to be raised by her aunt and uncle. So this history has a particular interest to me.

One thing I plan on doing, if we can work out a partnership, is to set up an evening in Eureka at Tintic High School where townspeople can come in with photographs and tell their stories of mining and life in Eureka before and after the EPA efforts. We’ll scan the photos and videotape the recollections, then combine all that with the video I’ve already done of the Tintic Mining Museum and local area. Ultimately, my students will help me script and edit a three-part video on the Tintic District, perhaps even done well enough that we could market it to KUED, the PBS station in Salt Lake City.

Tintic load site

Ore loading platform in the Tintic Mining District

The months July, August, and September will be dedicated to this effort and will result in the best documentation created so far on video of the history and present of the Tintic Mining District.

October will be dedicated to Zosimos of Panopolis and such Arabic alchemists as Jabir ibn Hayyan. November will begin a discussion of European alchemists, from Roger Bacon and Ramon Llull through the Middle Ages. I’ll draw on the many photos I’ve taken on alchemical texts at the Chemical Heritage Foundation. The history of alchemy will continue through December, 2012 and on into January, 2013. In February and March, 2013, we’ll discuss the emergence of modern chemistry through Boyle, Priestley, and Lavoisier through Dalton, Avogadro, Berzelius, and others.

In April through June of 2013 we will switch gears and talk about nucleogenesis and the origin of the elements, then the physicists and chemists that have helped us understand the structure of the atom and quantum mechanics. From there, I will probably begin to talk about individual elements and how they are mined and refined, with examples of the mining districts where they come from, such as the history of the Viburnum Trend in Missouri and the lead mines there, or the gold mines of Cripple Creek, Colorado. I really do have enough materials now to keep this blog going for at least two years. And I’ll be gathering more all the time. I will also dedicate occasional posts to my efforts as a chemistry teacher and to science education in general, including my experiences at conferences, etc.

Van Helmont

Portrait of Joannes Baptista van Helmont

Well, it is an ambitious schedule. I hope to do at least one post per week, probably on weekends. I hope to complete at least one video segment every two months or so. Next week, I’ll start us off with an overview of the history of chemistry.

Read Full Post »

Once each year I like to go over the statistics for this blog in detail to see what posts have been the most popular, which search terms are finding this blog, which videos are most watched, etc. I’m not doing this just for an ego trip, but to be able to report the impact this site is having. I have had some very generous sponsors over the three years this blog has been running, especially the American Section of the Société de Chimie Industrielle (which paid for my fellowship in 2009) and the Chemical Heritage Foundation, which provided such a wealth of resources in its collections on the history of chemistry. It was during the time of my fellowship that this blog really began to find an audience, and it has been growing ever since.

Stats for the Elements Unearthed

Monthly Stats for the Elements Unearthed Blog

So here is where this blog stands: As of today, there have been a total of 67,620 visits to this site. As seen by the histogram, the number of visits has shown a definite annual pattern consistent with the school year – visits are lower in the summer when school is not in session, rise in August and September, stay high in October and November, dip a bit in December due to Winter Vacation, then rise again in January and February and peak in March, then gradually decrease as the school year winds down in April and May. This same pattern has repeated for the last three school years, but has grown each year. Last year, in the 2010-2011 school year, my best months were slightly above 3000 visits. Now they are topping out above 4000 and I hope they will hit 5000 by March.

Granted, compared to some popular blogs with thousands of hits per day, 5000 per month doesn’t sound like much. However, I am pleased – this is a rather esoteric blog dedicated to the history of chemistry and chemistry education. The yearly pattern shows that I am reaching my intended audience of high school students and teachers. This is also shown by the types of searches that reach my blog.

Although there are always some unrelated search terms that somehow reach my blog (the biggest ones are “Ocean City, New Jersey” and “Punxsatawney Phil” because I visited both places in 2009 and showed some pictures), by far the majority of search terms are related to chemistry and its history or to science education in general. I’ve gone through the search terms and compiled them into categories, mostly so that I can make plans for the future. Here are the top searches that reach this blog: (1) Greek Matter Theories (3473 searches) with Aristotle, Democritus, and Thales being the biggest ones; (2) the Periodic Table of elements (2288); (3) beryllium (1600); (4) Alexandre Beguyer de Chancourtois (1397) – this is a bit surprising, but apparently my animation of his telluric screw periodic system and description of his work is one of the few sites out there about him; (5) the Tintic Mining District (1041); (6) the history of the periodic table (868); (7) science education (862), especially using iPads in science classes; (8) early modern chemistry (822), including Lavoisier, Boyle, Priestley, Dalton, and Newton; (9) alchemy (732), with love potions, Khunrath, Basil Valentine, Zosimos, and Maier the highest; (10) water and wind turbines (618); (11) strange attractors (586) – this is another odd one, since I only mentioned it once, but it was in my most popular post; (12) mercury (554); (13) early technology (514), such as Roman glass, Pliny the Elder, Agricola, Neri, and others; (14) mining in general (455) – such terms as overburden, open pit mine, ball mill, and headframe; and (15) Cripple Creek, Colorado (315).

Top Posts for this blog

Top Posts for the Elements Unearthed Blog

The videos that I have created for this project are posted on this blog (under the video tab) and on YouTube. The History of the Periodic Table, featuring Dr. Eric Scerri of UCLA, is my biggest hit so far. All parts of this video have been watched a total of 11,474 times as of 1/7/2012. There are even a few derivative works on YouTube that take parts of my video – a section on Henry Moseley, for example – and combine it with parts of other videos with Bill Nye, etc. I’ve had quite a few comments on how useful this video has been for chemistry teachers out there, and I am very pleased with the results so far. There is also a version with Portuguese subtitles done by a professor in Brazil; I’m not sure how many times that has been seen. My separate video that showed only some animations of the periodic table has been watched 416 times.

The second most popular videos have been the two parts on beryllium – its properties and uses, and how it is mined and refined. It has been watched a total of 3219 times, with the separate video on the geology of beryllium watched itself an additional 153 times. The Discovery of Synthetic Diamonds has been watched 745 times and the demonstration of Glass Blowing 754 times. These have been the most popular videos related to this project.

In conclusion, the most important question is: Have I succeeded in my attempt to bring the history of chemistry and chemistry education to the general public, and specifically to teachers and students? All indications, based on these statistics, are that I am succeeding and that that success is continuing to grow.

The last several posts have been about astronomy and space science education, and although some search terms have reached these posts, not many have. For various reasons, not the least of which is that I want to keep this blog focused on my original intent, I am starting a new blog which should be up and running by Wednesday night on space science education and resources for teachers to use now that we are in the golden age of astronomy. I will be doing quite a bit of education outreach on these topics over the next few years, if all goes well, and they deserve to have their own blog. I will include links here once that is ready to visit. I will post to this new blog once per week on Wednesdays.

The statistics also point out which topics have been most popular, and give me direction on what to post about in the future. In my next post, I will give you a schedule of what I intend to discuss over the next year and a half and when I will have the related videos completed. I will try to post once per week, probably on weekends. I have much more material from my fellowship at the Chemical Heritage Foundation that I haven’t shown or discussed here yet, and I look forward to digging into it all. I have also visited many sites related to mining and refining of the elements which I have only mentioned in passing. It’s time to edit all that footage and photos into videos for this site and YouTube. I expect the next few years to be busy, productive, and rewarding and to reach even more people than I already have.

Read Full Post »

Foam demonstration

David Black presenting foam demonstration

Yes, I know this is late. The new school year is about to start and I am only just finishing up the last school year. This post will describe the Grand Finale of the school year for my science classes, which was our First Annual Science Showcase at Walden School.

We had been working toward this all year, as you have seen from previous posts. Students in my astronomy and chemistry classes joined into small groups (2-3 students) and chose topics based on what interested them and what materials and equipment I had available. Then during first term, they conducted background research. My chemistry students created posters and several of them contributed posts to this blog. During second term, the teams condensed their research into a script for a presentation or mini-lesson on their topic which was to include explanation, background, and some type of demonstration or hands-on activity. The teams practiced and refined their scripts, then I divided the teams in half. Half of each class presented their demonstrations/lessons to their peers in class, and I had their fellow classmates fill out an evaluation form with Likert-style point scales and room for comments. The other half presented to our elementary classes and wrote evaluations on themselves. In astronomy, the students merely presented for the elementary classes once.

science night assignments

Assignments for Science Showcase

During third term in chemistry, the teams went over their evaluations and improved their scripts. I had them start to create Powerpoint slide shows or add YouTube videos to increase the depth of their presentations. Then the teams presented again – those that presented to their peers now presented to the elementary classes and vice versa. Evaluations were again filled out, with even more detail. I also wrote up my own detailed suggestions for each team.

copper group presenting

Copper group presenting at Science Showcase

Finally, fourth term, we made our final preparations and practiced and set up our Science Showcase on May 16. I also asked the astronomy students to return and reprise their presentations, and had my geology students help out. Since our school is small, many students presented twice (and got extra credit for it). We set up an invitation for the parents and had it e-mailed out to the whole school mailing list. It took a lot of preparation, and wouldn’t have been possible without the support of the Air Force Association Educator Grant, which helped to pay for materials and supplies that were used up each time we presented (like plastic cups, red cabbage, white glue, etc.).

Schedule for science night

Schedule for Science Showcase

We set up the evening to be in three classrooms and outside on the school’s back patio (for the dangerous or messy presentations). The teams were assigned carefully so that those who were doing more than one session could make it to each one. Some students also got credit for helping film the sessions, making sure the refreshments were done (homemade root beer and ice cream, which were actually presented at two sessions), acting as hosts for each room, etc. For four sessions we had four presentations going at the same time, or about 16 topics altogether.

Dry ice group

Dry ice group presenting at Science Showcase

It was a bit frustrating to get the students all there on time (an hour early) and a few things I wanted to do didn’t get done, but overall the night was a huge success. I had about 30 students involved, and there were about 40-50 other people who attended, some other students, some parents, some siblings. A few of the sessions were too short, and the student hosts in each room didn’t watch the clock well enough, so the schedule got a bit messed up by the end, and we had to take a break for refreshments. The homemade root beer (we already had dry ice) and ice cream (another presentation) went over well. Some of the sessions only had a few in the audience, others were packed.

Flame test abstract

The last session was done by Jerry and Karl on properties of the elements and how fireworks are made, and in addition to the methanol flame test, Karl had made his own sparklers. He’d looked up a recipe online, but I didn’t have all the exact ingredients, so we substituted and experimented for a few days and came up with a viable recipe, one that actually works better than commercial sparklers. It was nice to have a grand finale, so to speak.

Homemade sparkler

Homemade sparkler demonstrated at Science Showcase

We videotaped and photographed everything, and I am still trying to capture and compile the video. I have only two weeks left until school starts, and my goal is to put together a final 15 minute video of all our presentations for the year before school begins so that I can show it to my next classes and post it here.

Solid rocket booster

Toasting the Runt: A solid rocket booster

As an assessment of the evening, I didn’t have any kind of feedback forms, but based on overheard comments, feedback from parents and other teachers, and general excitement of my students, I’d say the evening was a great success. Everyone had fun, most of the presentations worked well, the students came through very well, and I saw some genuine learning and expertise displayed by my students. Certainly they have come to feel comfortable using lab equipment and presenting to their peers and others. What they presented they have now learned deeply and will never forget, long after stoichiometry and thermochemistry have faded away. For our first year doing this, we have set up a good foundation. There are things that can be improved, of course, and I hope to get the other science teachers involved this coming year. At least now my students know what to expect.

Homemade root beer

Homemade root beer

I hope to have several students display their science experiments, where they designed, observed, and analyzed their own data for science fairs. My one science fair student displayed his computer game project and it was well attended and received. Next year, as we are involved in authentic NASA research, we’ll have more students doing the real thing. But more on that next post.

Moon craters

Moon formation and evolution demonstration

Josh shows game

Demonstrating the "Salt the Slug" game

Silver group presenting

Read Full Post »

titration

Students preparing for an acid-base titration

My last post told about our school’s trip to Moab in March and about the discovery of uranium in that area by Charlie Steen. Since then I have not been as active on this blog because I have been spending much of my spare time finding and applying for grants and now preparing for my fall classes. The last term in chemistry was also fairly hectic as we went through several units, including acids/bases, electrochemistry, and thermochemistry.

Titration equivalence point

Finding the equivalence point in an acid-base titration

The grant game isn’t a very fun one to play. There are many losers and only a few winners, and a great deal of effort is required for what is often no reward at all. Unfortunately, as science teachers, we know that to do the engaging, exciting hands-on activities that are the hallmark of good teaching, we often need funds well beyond what our school districts can provide. During difficult financial times, when district budgets and state tax revenues are shrinking, more and more of us are applying for ever scarcer opportunities. So it becomes a numbers game; the more grants you apply to, the more your odds of success for a few of them. Sometimes you luck out.

During the period between March and May, when classes ended for the year, I applied to three grants. Two I haven’t heard back from yet (the Dreyfus grant program and the Presidential Award for Excellence in Math and Science Teaching [PAEMST]) but one, the McCartney-Dressman Grant, sent me a form e-mail last week saying we had not been selected. There were over 400 applications. In many cases, including this one, grant monies have stipulations such as requiring the schools to have a high number of underrepresented students, which means having a certain percentage of students with minority status, or classified as poor by the percentage applying for free or reduced lunches, or by being in an urban or rural geographical area. Walden School is located in Provo, Utah, which is not rural or urban, and although some of our students are on free or reduced lunches, the percentage isn’t particularly high. In other words, we’re not considered underrepresented. I knew that going in, but decided to try anyway.

For the PAEMST program, this is the first year in 15 that I have qualified. To apply, one has to be a science or math teacher (at least 50% load) in a public or private school and the application process is pretty intimidating. I went to a presentation at the Utah Science Teachers Association conference this last February, and found that in addition to a lengthy essay with supplemental exhibits, one has to also provide a 45 minute video of teaching that has no breaks in it – just one continuous lesson. This is harder than you might think, even for a video professional like myself (maybe especially for me) because I want good quality video as well as good quality teaching. I filmed my chemistry classes on two different days doing activities – one was testing Charles Law that gases expand when heated by having them measure the diameter of balloons as they were dipped in water of different temperatures. That video looked good and had some good comments by the students, but as I moved the camera the video started and stopped on its own, so I couldn’t use it.

Molarity problems

One of the requirements of the PAEMST application: Provide proof of student learning

Then I videotaped my students doing a lab testing the voltages between different metal electrodes. Not as interesting, perhaps, but it went well enough. I got some nice letters of recommendation from a student, a fellow teacher, and my school’s director, wrote up the essay, created a ten-page supplement document, and sent all of this off by the deadline in May. Now the people in Utah have to decide which applications to send on to the national selection committee, and we won’t find out if we’ve won until next May (a whole year). Then in December, 2012, if I’m selected, I get a trip to Washington, D.C. to meet President Obama (maybe – sometimes the president doesn’t show up to present the award named after him) and receive a check for $10,000. Yes, it’s quite a process and if I don’t make it (I don’t know how many actually finished applications – probably ten or so) then I have to wait for two years (2013) before I can apply again as they alternate high school and elementary teachers. Each state gets one math teacher and one science teacher per year (although sometimes the national committee doesn’t select anyone from a state if they feel none qualify).

Charles law lab

Results of the Charles Law lab

As I was looking over the list of previous Utah awardees, I came across the name of a teacher I used to teach with at Juab High School. Janet Sutorius is an excellent math teacher who has also participated in the NASA Educator Workshop program at Dreyden Field Research Center at Edwards Airforce Base. Even after I left Juab HS, I did a workshop presentation with Janet on NASA educational programs at a state conference. Here is a nice article about Janet as an alumnus of Brigham Young University: Janet Sutorius Presidential Award. Other past awardees I know include Duane Merrill (I learned how to teach conceptual physics from him), Ron Cefalo, and others. These are all excellent teachers and role models for me.

The fact that I’ve been out in the wilderness teaching multimedia for ten years means I haven’t been in the spotlight for science teaching (even though I was doing all the NASA stuff). I was actually better known outside of Utah than inside. I did present at the USTA conference frequently, including this year. Many of the people I worked with as a NASA/JPL Solar System Educator had been Presidential Awardees, and when I asked about the program they all said I should apply. But I had to be an official science teacher before that could happen, and this year is the first time since Juab High School. I think I have a strong application – I’ve certainly done more on the national level for teacher professional development that anyone else I know in Utah, but that is just one dimension they look at. I think my content knowledge is excellent, and I’m strong on the other dimensions as well. Anyway, win or lose, I have tried. There have been many times in the past when I have applied for similar programs and thought I could never be selected but was. Maybe this will be one of those times. I just wish I didn’t have to wait so long to find out!

Read Full Post »

My last post had me still in San Francisco at the NSTA national conference. That was March. Now it’s May, and I don’t quite know what happened to April. Let me try to catch up on myself and this project.

Me and Explore Mars

Chris Carberry, Myself, and Artemis Westenberg of Explore Mars

Back in San Francisco, I had just been awarded 3rd Place in the Mars Education Challenge by Bill Nye (yeah, that guy) and by the Explore Mars Foundation. That was on Thursday, March 10. On Friday, March 11 I attended a number of excellent presentations including one on an online student science project from Mt. Pisgah Observatory to classify stars based on their absorption spectra. Thousands of photographic plates with the stars’ light refracted into spectra have been digitized and made searchable. A spectrum from a star can be compared against standard spectra for major stellar classes and subclasses. I will incorporate this activity into my astronomy classes.

My second session was to be over in the Moscone Center on how to use the iPad in science education, a subject I’ve talked about here before, but when I got there the room was packed and people were standing in the aisles and flowing into the hall. This isn’t too surprising – as I saw later that day at the nearby Apple Store, the lines were very long (all the way around the block) and Apple employees were handing out fruit (apples, of course, and oranges) and granola bars just so people wouldn’t pass out from lack of food for waiting so long. The reason: the iPad 2 came out that day.

Apple lines

Lining up for the iPad 2 at the Apple Store in San Francisco

Instead of the iPad session, I went next door to a good session on project-based learning in the classroom, where a junior high in Lincoln Parish in Louisiana has created a program that is completely project based, yet covers all core curriculum. I found out more about it from the presenters afterward.

I had planned on going to more sessions, but since I was in the Moscone Center it seemed a good time to check out the dealers exhibit. The exhibit hall is a huge, cavernous space with the big name companies jockeying for prime spaces by the main entrance and smaller companies along the aisles in the back corners. I was ostensibly looking for the Explore Mars booth, but I systematically covered the floor and visited anything that caught my eye, picking up a lot more materials to take home than I really wanted to. I was glad I left some space in my suitcase. I finally found the Explore Mars booth on the NSTA aisle (the competition was sponsored by NSTA) and I reported in to Artemis and Chris, who said that the first place winner had arrived and that we would have another small presentation later that afternoon.

I went to lunch, finding a place about a block away called Mel’s Diner. As I sat down at a stool at the counter, the person sitting next to me turned to me and said, “Well, Dave, how are you?” It was Eric Brunsell, who now teaches at the University of Wisconsin at Oshkosh. I first got to know Eric through the NASA/JPL Solar System Educators Program (SSEP), the same group I had dinner with the night before. Eric was with Space Explorers, the group that managed the training sessions for SSEP. We had a good talk about what he’s been doing and on the problems currently being faced by teachers in Wisconsin, where the governor is trying to destroy the teachers union and cut teacher benefits and retirement.

Down to the Bay

Looking down to San Francisco Bay from the top of Nob Hill

Back at the Moscone Center, I reported in at the booth and met Howard Lineberger, the first place winner. Andrew Hilt (2nd place) and Howard and I stood with Artemis and Chris and officials from NSTA for more photo ops, and were interviewed by Chris on camera on our feelings about Mars exploration. Chris and Artemis had to go to another reception, so they asked us to man the booth until the end of the day. Andrew and I talked to anyone who was interested about the competition and showed them our lesson plans.

Chinatown

Chinatown in San Francisco

Afterward, we decided to walk up to Chinatown for supper. We headed to my hotel to drop off my stuff, then to Andrew’s hotel, then we walked up Nob Hill. We wound up going too high (it is quite a steep hill and we got a good leg stretching) and had to wander back down to the east into Chinatown. I found a really good Chinese bakery, where we sampled the yedz (coconut rolls) and I later bought a koushu binggan (kind of a graham cracker cookie). We found a promising SzeChwan restaurant and had supper. I found out the Andrew and Eric Brunsell are friends and have worked on common projects together. Small world! We also compared notes on our astronomy classes. We walked back down to where our hotels were, and I said goodbye (Andrew is heading home tomorrow). I found a good souvenir cable car ornament for my wife, then headed back to my hotel.

Read Full Post »

The Mosser Hotel

The Mosser Hotel, San Francisco

The last two weeks have been crazy busy as our third term has ended, our Intersession classes have begun, and I’ve prepared to travel to San Francisco for the National Science Teachers Association Conference.

During Intersession our history teacher at Walden School (Eric) and I have put together a CSI class, coming up with a scenario, clues, evidence, witnesses, etc. On the first day, we trained the students what to expect and divided them into groups, including three students to be lead detectives. I also ran them through my old “Murder on the Carob Bean Queen” activity, where they must solve a paper mystery that requires group collaboration. On Tuesday we planted the evidence, including a very well made up dead body, multiple sets of footprints, and various physical clues. I even got some beef blood from the local supermarket and splattered it over the scene (getting quite a bit on myself – I was a bit overenthusiastic on how I smacked the container). While I was doing this, Eric had the students inside with a guest lecturer from the medical examiner’s office. She brought slides. I was glad to miss it. Then we took the students outside to the crime scene and had them collect the evidence. They did pretty well, except they only got two footprints cast, the rest of the prints either being ignored or obliterated as the team walked all over the scene. Wednesday we started cataloguing and analyzing the evidence, as witnesses started to come forward and the crime started shaping up.

Lobby of the Mosser

Lobby of the Mosser Hotel, San Francisco

At the same time, I was busily getting my bags packed, last minute changes on the presentations ready (including quick videos of Cripple Creek and my students’ chemistry demonstrations), and all the details done that must be done.

On Wednesday afternoon, I flew on a small Skywest Puddle Jumper from Salt Lake to SFO. I sat by a pre-teacher from Louisiana State, behind two other teachers, and they behind yet another teacher, all going to the conference. There must have been quite a few more on the same plane. We teachers are quite the gregarious bunch.

The plane flight was uneventful, and in between chatting with the other teachers I watched an episode of Star Trek Enterprise on my laptop. There’s just something oddly fulfilling about watching Star Trek on a laptop computer while flying at 35,000 feet. We had a nice view of San Francisco and the Golden Gate Bridge from the air as we circled around to land. I rode into San Francisco on a SuperShuttle van with yet more teachers to the Mosser Hotel. I selected the Mosser because it is inexpensive (about $60 per night, which is really good for a San Fran hotel). The drawbacks are the tiny rooms and shared bathrooms, but the beds are comfortable and the hotel staff friendly. After settling in, I walked over to the Moscone Center and picked up my registration packet. I found a Mexican restaurant in the Metreon, and sat with a teacher named Matt who teaches in an ex-patriot school in Bangladesh. We had an interesting conversation about the challenges of teaching in a country with such severe poverty and population issues; he tried to paint a picture of just how terrible the traffic is, for instance, and how prone to disasters of every sort the country is.

San Francisco skyline

San Francisco Skyline from the Moscone Center

After dinner, I returned to the hotel and crashed. It was a long day, and tomorrow will be very eventful. I present the Elements Unearthed project, and I have a reception to go to where I’ll receive a “major award” (although not from France or in a box marked “Fragilé”). Just thought I’d end on a note of suspense . . . .

Read Full Post »

Gay eyeballs

Making gak eyeballs at Walden School

This last week was our final week of Fall Semester at Walden School, and for their final test my chemistry students planned, practiced, and presented chemistry demonstrations to their peers and to Walden’s elementary classes. Altogether five groups of students presented to the elementary school on Wednesday, Dec. 15 and the rest of the student teams presented on Friday, Dec. 17.

I’ve discussed my rationale for doing this in previous posts: that this is an excellent method for generating excitement about STEM in elementary students as they see their older siblings and high school students working with and presenting science. Certainly the younger students were very excited and attentive; they were eager to participate and asked good questions.

Raising hands

Students at Walden School participating in chemistry demonstrations

For me, though, the real reason for doing anything in my classes is always how it will benefit my students. Taking 3-4 days out of our curriculum to practice and present these demonstrations is hard to justify unless it has strong pedagogical advantages. The justification is this: as my students write up their demonstration scripts and outlines, as they practice talking about the science they are presenting, and as they prepare to answer questions from the audience they are thoroughly learning the chemistry behind their demonstrations. They are going beyond hands-on labs to share what they have learned, and that learning will be indelible.

Karlie and Sofia

Karlie and Sofia demonstrate hand warmers

The topics of the demonstrations had to related to the individual element/materials research project of one of the group members, which they are continuing to work on. Here’s what was presented:

Sofia, Karlie, and Jerry demonstrated the principles behind hand warmers by showing the rapid crystallization of sodium thiosulfate crystals that had been heated and then cooled down. They also talked about crystals in general.

Making gak

Mari and Casey help students make gak

Ryan and Casey, with help from Chelise, Lindsey, and Mari, demonstrated how to make gak (a polymer made out of white glue and borax powder). This is an old standby demonstration, and the kids really enjoyed it.

Copper demonstration group

Genny, Rachel, Jared, and Morgan demonstrate copper's properties

Genny, Rachel, Morgan, and Jared demonstrated aspects of copper chemistry. They handed around samples of copper ore (Rachel’s uncle is an engineer at Rio Tinto’s Bingham Canyon Mine in Utah) and showed a methanol version of a flame test (including copper salts). Jared demonstrated the alchemist’s dream reaction: turning copper into gold (actually brass).

Kinesthetic activity

Sid and Sam use a kinesthetic activity to demonstrate magnetic induction

Sam and Sid, with help from Josh, presented the idea of magnetic induction and discussed how modern electrical generators work. Sam actually built her own alternator and induction coil, and Sid presented on his research about the use of wind power to generate electricity. They also created a fun kinesthetic activity to show induction.

Burning magnesium

Karl and Nicona demonstrate burning magnesium

Karl, Nicona, and Tanner presented on the properties of the elements; they did a flame test as well, and demonstrated what magnesium ribbon looks like when burned and how fireworks get their colors. They also had sparklers for each of the students to try out.

Cabbage pH

Sonora, Dallas, and Morgan demonstrate cabbage pH

In class on Friday, the other groups presented their demonstrations. Sonora, Morgan, and Dallas presented the red cabbage pH demonstration that is one of my favorites.

Untarnishing silver

Mari and Holly demonstrate how to un-tarnish silverware

Courtney, Holly, and Mari showed how to untarnish silver using baking soda and aluminum foil. They even included a correctly balanced chemical equation, although we won’t be learning about those until we return in January.

Dry ice group

Libby, Lindsey, and Chelise demonstrate the properties of carbon dioxide

Chelise, Lindsey, and Libby presented the properties of carbon dioxide gas and dry ice. They showed how regular matches go out in carbon dioxide, but that magnesium burns even brighter when placed in carbon dioxide.

Olivia and Jace

Jace and Olivia explain the ingredients of gunpowder

Jace and Olivia talked about gunpowder, how it is made, and why it is dangerous. Jace has experience working with black powder (he has his own muzzle loader – this is Utah, after all) and he created some raw gunpowder, which he burn outside. They also demonstrated the “fire writing” demonstration of drawing on a piece of paper with a saturated solution of potassium nitrate, then touching a wooden splint to the edges of the writing to see it burn letters through the paper.

Josh and Jess

Josh and Jess demonstrate the principle of density with salt solutions

Josh and Jess presented on salt solutions and how they can be used to determine the density of objects. They showed how an egg will sink in pure water but will float in salt water.

We also videotaped as much of the presentations as we could and took quite a few photos; those students that weren’t helping present helped with the photography.

Burning gunpowder

Burning gunpowder

When their demonstrations were done on Wednesday and Friday, my students were excited about what they had done and the feedback they’d gotten from the younger students. They still have to learn some showmanship and presentation skills (which we’ll continue to work on), but based on what I saw and what the elementary teachers reported, the science content was excellent. They and their peers filled out evaluation forms (and I will as well) so that they can improve on their presentations for the next round in January.

Golden pennies

Golden pennies

It was a lot of work to prepare for this. Now my lab room is a mess and I’ll need to take a day during Christmas break to clean up and re-organize (and I think I forgot to throw out the leftover red cabbage pulp that’s in my trash can, so I’d better go clean up tomorrow). But despite the work and the lost time, I’d say these demonstrations were well worth it. As we go through the second semester, the students will present at least twice more, including a final time at a back-to-school night for their parents. We’ll polish the delivery, add more science explanations, create slide shows and videos to supplement their demonstrations, and by the end of the year these will be incredibly well done.

Read Full Post »

Older Posts »