My summer this year was mostly taken up with astronomy related activities. I flew on SOFIA (see my other blog: spacedoutclass.com) and took an astrobiology workshop at the Great Salt Lake to study extremophiles in June, then spent most of July writing up my experiences and archiving the SOFIA video clips. But during the first week in August, I did return to chemistry and the elements as I participated in a materials science workshop offered by ASM, the materials science association of America (yes, I know, the acronym doesn’t fit. It used to be the American Society of Metallurgists, but has grown to include all material sciences, so now it’s just ASM International). I had heard of these workshops before, and this is the first time they’ve been offered in Utah. When the announcement went out from the Utah State Office of Education, I signed up immediately.
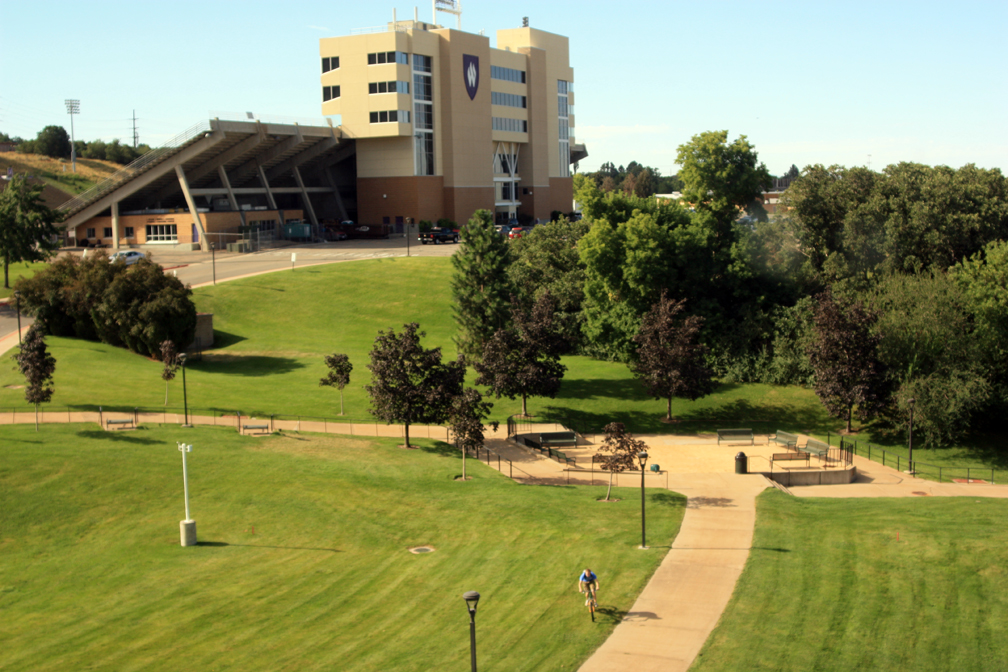
Weber State University campus seen from the science building
The workshop was held at Weber State University in Ogden. I couldn’t attend the one at BYU because I was in Palmdale flying on SOFIA that week. Even though it was a bit of a drive to go up to Ogden for five days, I did manage to carpool the last three days with two other teachers from Utah Valley, and we had some good conversations while driving up and back. We met at the Park and Ride at Thanksgiving Point each morning. One was a middle school science teacher in Alpine, the other a Technology teacher at the Nebo Learning Center in Springville. Other teachers in the workshop ranged from chemistry teachers (and a WSU chemistry professor) to industrial arts teachers doing Project Lead the Way. Getting to know the other teachers is always a highlight of attending these workshops.
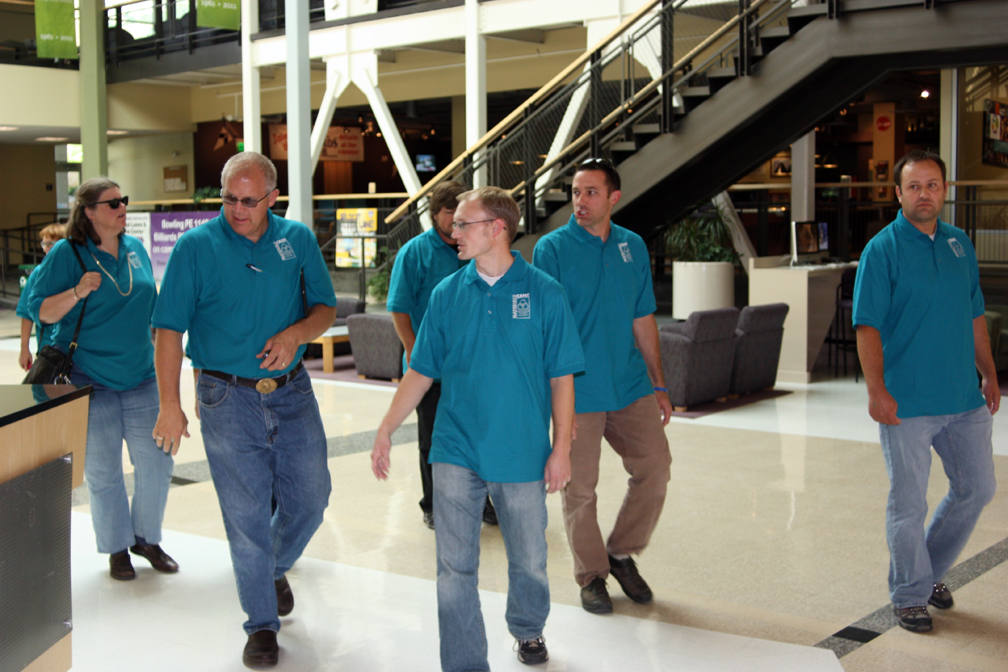
Teachers in the ASM Materials Science workshop at WSU
The course was taught by Becky Heckman, who teaches materials science courses at an International Baccalaureate school in Princeton, Ohio outside Cincinnati; and by David McGibney, a teacher from Sammimish, Washington. He was also a finalist in the original Teacher in Space program. A third teacher, Chris Miedema, from Ottawa, Canada also helped out as an ASM trainee teacher. All three have been through these workshops before and have received additional training to present them, traveling to several locations each summer for a week at a time.
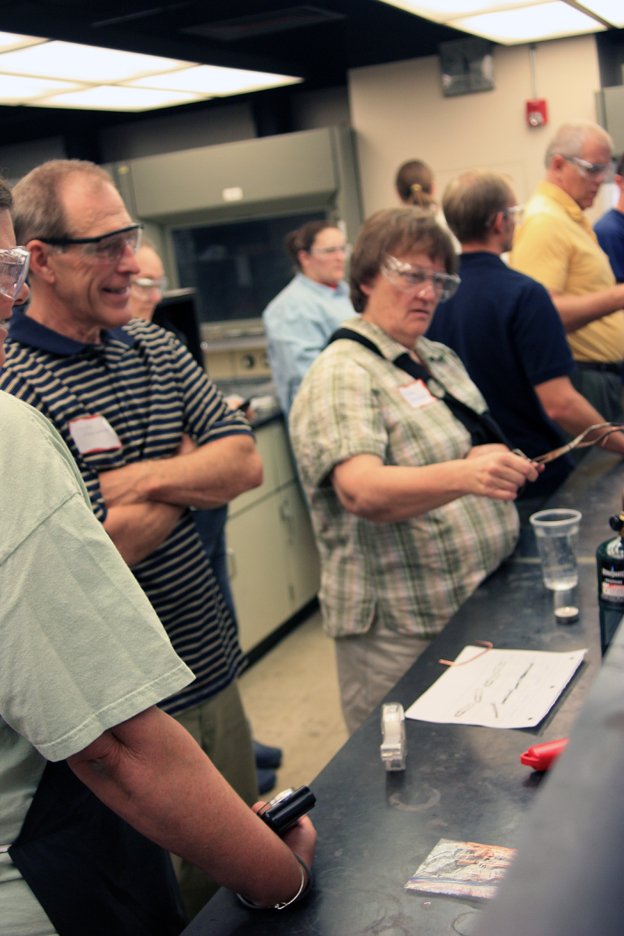
Weber State University chemistry lab, with Dr. Donaldson and his wife.
The course was divided up into sections by the types of materials, with an overview on Monday. We looked at the properties of metals, ceramics, glass, composites, and polymers and alternated our time between in-class discussions and demonstrations and lab activities. We were in the current WSU science building (a new one is being built) and used the chemistry lab upstairs. Some of the labs I’ve done before, such as the activity series of the elements, but we did them in new ways or from different perspectives. Most of the labs will be directly useful in my chemistry class this year. A few use equipment that will require some grants to get, such as a small kiln for raku pottery that runs about $800. They provided some starter materials, such as a bag of sodium polyacrylate and some metal electrode kits, that were given by various chemical companies.
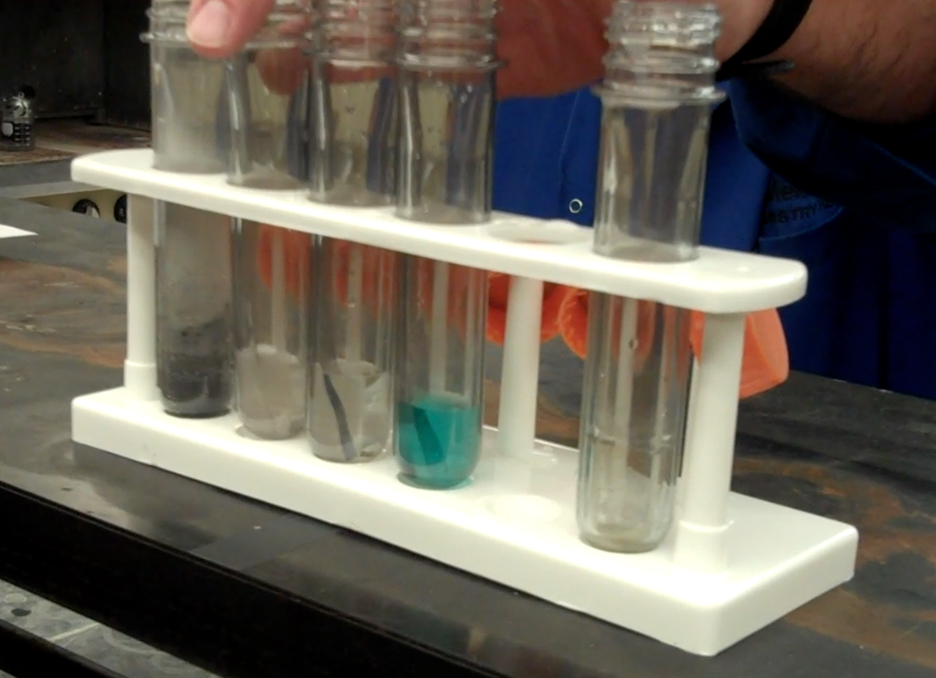
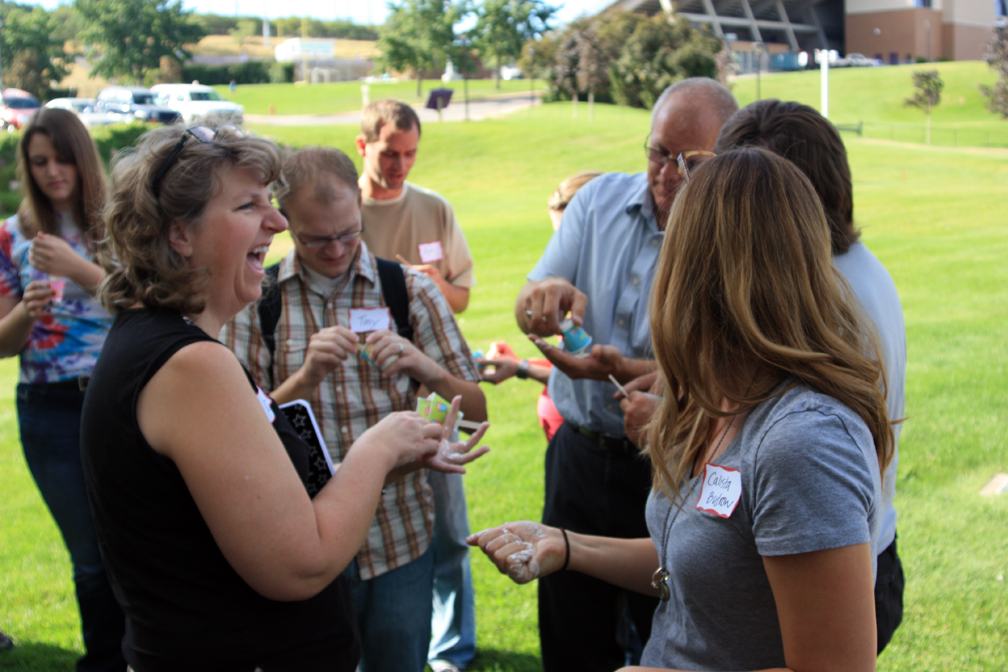
Testing the Reactivity of Metals in Copper Sulfate Solution.
Workshop Highlights:
Activity Series with Copper: We used plastic bottle performs instead of test tubes to test various metals in a solution of copper sulfate, then observed the differences in reactivity. This is a variation of the Activity Series of Metals lab, but is presented as an excellent inquiry/discovery lab. I’ll use this during my second semester as we talk about reactivity and reaction types, leading into my lab on copper compounds.
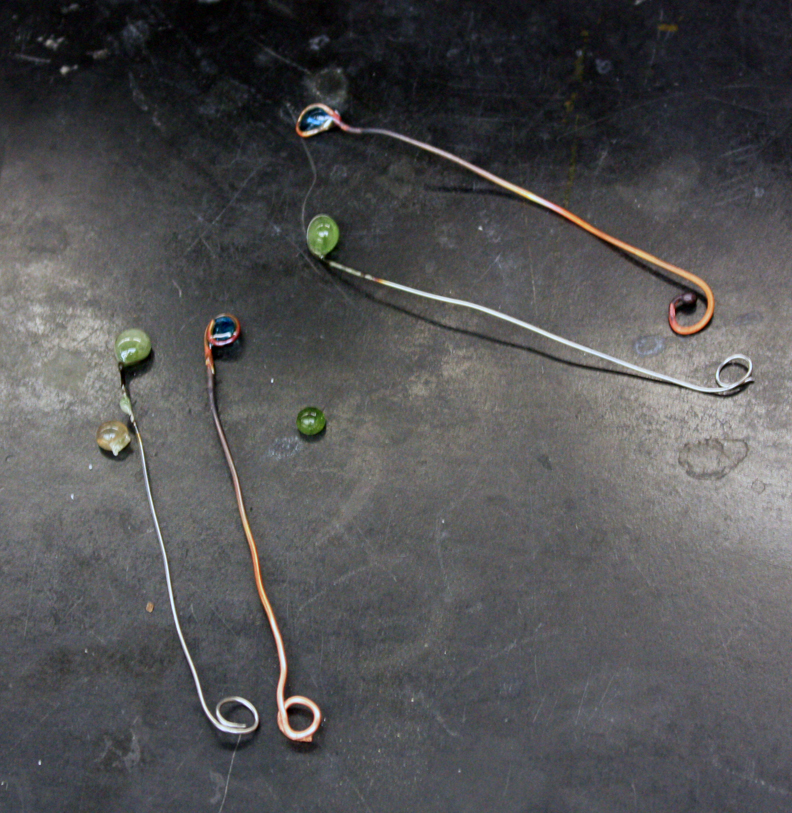
Borax glass beads. The green beads are on nichrome wire, the blue beads on copper wire.
Borax Glass Beads: We had two types of wire, nichrome and copper, bent into small loops. We heated up the loops in a torch flame, then dipped them into a cup with borax powder, then heated it again, until a bead of vitrified borax formed in the loop. The nichrome bead was green, the copper wire bead was blue. It took some practice not to get too much borax on the loop, so that it didn’t drip into the torch burner.
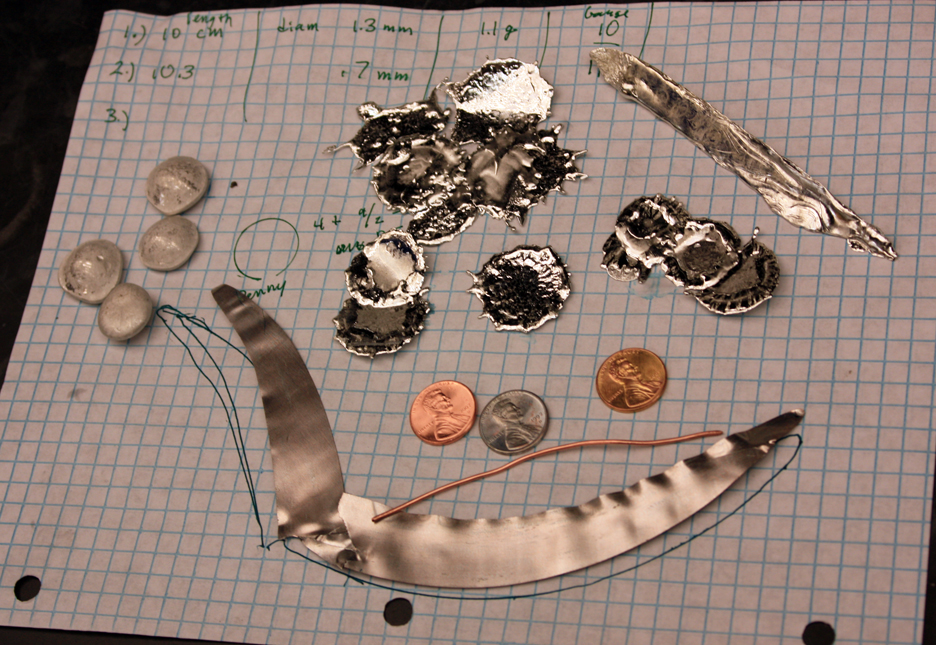
Metal Activities. From Bottom clockwise: A penny squished through a stretching machine, tin and bismuth alloy buttons, tin splotches and shreaking tin, pennies turned to “silver” and “gold.”
The Alchemist’s Dream: We did a variation on the old “turning copper into gold” lab that didn’t require pre-1982 pennies (which were made of pure copper). This one uses a solution of zinc powder and sodium hydroxide, just like the other version, but deposits the zinc onto the copper using electroplating. A zinc electrode is in the solution is attached to the positive lead, and the penny is placed inside a plastic spoon with holes in it and touched with a copper wire attached to the negative lead. The zinc appears instantly. It is less dangerous than heating up the zinc-lye solution, and the zinc layer is more even, producing a better-looking golden penny when heated up on a hot plate. I’ve already done this lab in my chemistry class this year with excellent results.
Playing with starch and water solution at the ASM camp.
Thixatropic vs. Dilatant Solutions: We did the old cornstarch and water oobleck lab (outside, as this is very messy) but looked at it from the perspective of thixatropic (adding shear force or shaking makes the solution less viscous, such as shaking a catsup bottle) versus dilatant (pronounced “die-laa-tant”), where shear forces make the solution more rigid, such as the starch-water solution. These are both examples of non-Newtonian fluids.
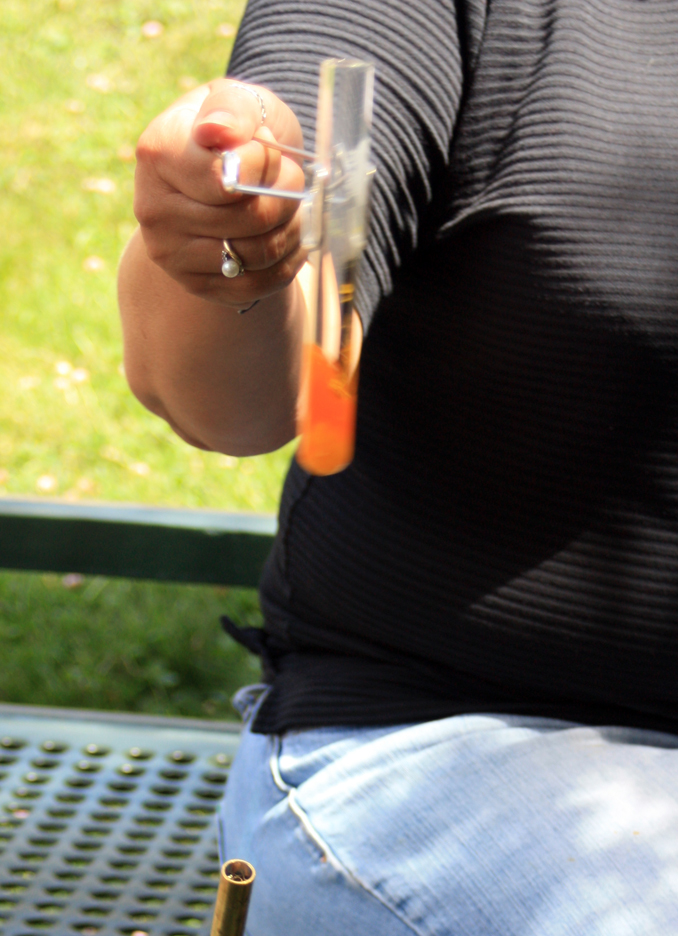
Making sulfur allotropes. We did this outside because of the smell.
Sulfur Allotropes: Heating sulfur flowers until it turns orange, then carefully pouring into water produces a rubbery form of sulfur. Depending on the temperature and how quickly it is heated, sulfur has several allotropes. We also produced sulfur crystals.
Crystal Bead Boards: Taking a DVD case and filling with small plastic beads, then taping it together to make a single layer. These beads can be shaken to illustrate crystal lattices and imperfections, such as linear cleavage planes, vacancies, etc. Mixing two colors of beads or even two sizes of beads can show substitutional and interstitial alloy structures.
Sir Ken Robinson TED Talk: A very provocative and inspirational talk on the nature of learning and education that all teachers should watch (all students for that matter). Here’s the link: http://www.ted.com/talks/ken_robinson_says_schools_kill_creativity.html.
Annealing, Quenching, and Tempering: We heated bobby pins and paper clips (having different levels of carbon in the steel) and tested how easy it was to break them after they had been annealed, quenched, and tempered. Then we learned the differences in crystal structure. A good introductory discovery lab, with inquiry, that I had never seen before.
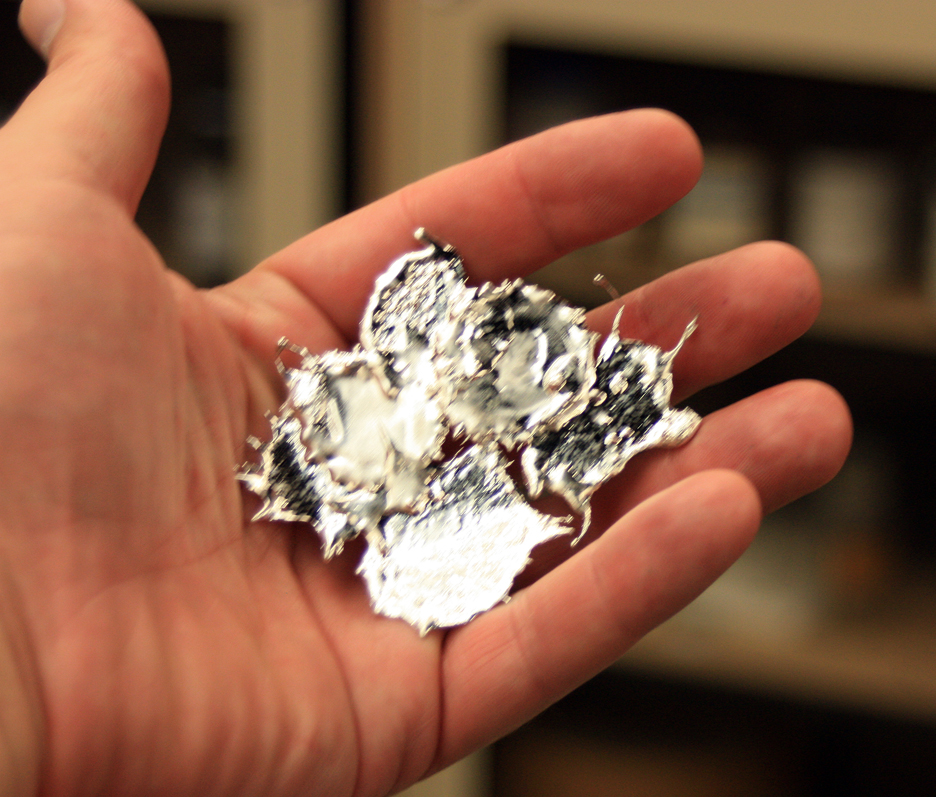
Tin splotches, made by dripping melted tin onto a steel plate.
Tin and Bismuth Alloys: We made a series of buttons of different percentages of tin and bismuth metals melted together. We then tested their melting points to see where the eulectic point (alloy with lowest melting point) was. This was at about 58% bismuth to tin.
Steel Wool in Vinegar: We placed steel wool in a small Erlenmeyer flask with vinegar and salt water, then placed a balloon over the mouth of the flask. We measured the temperature of the solution every ten minutes with a laser thermometer (I had never seen these before – pretty slick!) We were asked to predict what would happen with the balloon – would it inflate or deflate? We also did a corrosion lab with steel wool in water, salt water, hydrogen peroxide, and a combination and compared reaction rates.
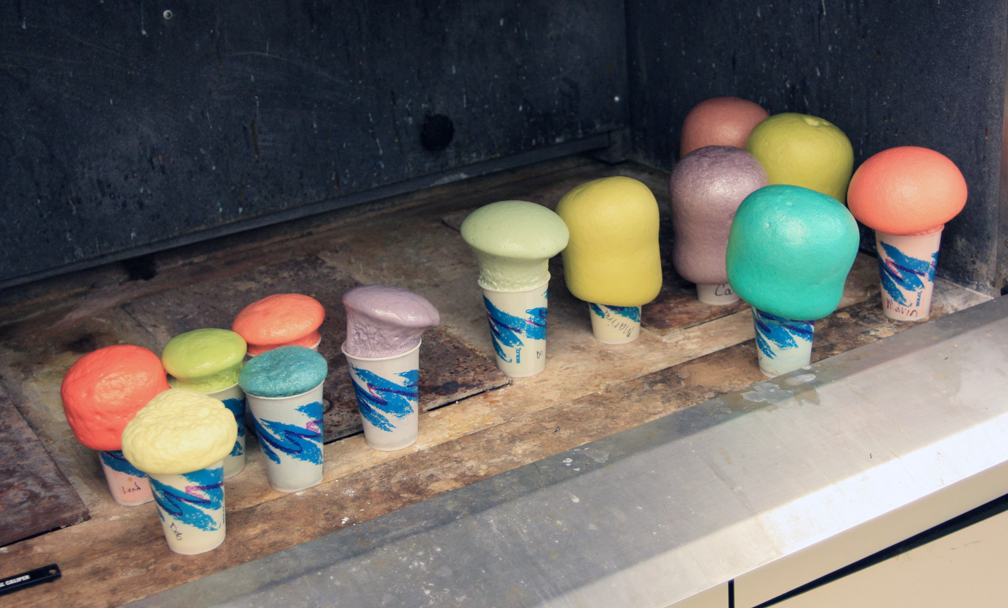
Polyurethane foam mushrooms colored with food coloring.
Thomas Thwaites video: A Welsh man received a grant to see if he could build a toaster from scratch, based on a quote from Mostly Harmless, the fifth book in the Hitchhikers series by Douglas Adams. Arthur Dent, who seems to have trouble hanging onto his towel, has landed on a primitive world where he assumes he will soon be in charge due to his advanced 20th century scientific knowledge. He soon discovers, however, that he doesn’t even have the skills necessary to build his own toaster. He can barely manage to make a passable sandwich. Thwaites decided to put the idea to the test; he took apart a toaster and catalogued the parts, then collected all the raw materials needed to build one himself. He had to melt the metal (which he got at an iron mine), create the plastic (he used potato starch, but snails ate it, and British Petroleum wouldn’t give him a jug of crude oil. He finally had to “mine” the plastic from a garbage dump), and he eventually got a crude toaster that lasted a few seconds before burning out. Here is the link to that video: http://www.ted.com/talks/thomas_thwaites_how_i_built_a_toaster_from_scratch.html.
Plastics Labs: We made polyurethane foam plastic, both rigid and flexible. We also made large clothespins, shrinky dinks (plastic cups painted with Sharpie pens, then melted in a toaster oven), a latex ball (although mine looked like a brain more than a ball), and a homemade Styrofoam shape from a mold and polystyrene pellets.
Shrinky dinks. The disk on the left was a #6 recyclable plastic cup colored by Sharpie permanent markers, then heated in a toaster oven. It shrank down to its original size before plastic forming.
Making Models of Composites: We created “diving boards” out of foamcore wrapped with tape, then tested their elasticity and Young’s Modulus. We also made “hockey pucks” from cement mixed with plastic Easter grass as a reinforcer, then dropped the pucks from different heights to compare reinforced vs. non-reinforced concrete. The reinforced cement held up to stresses and did not shatter as the non-reinforced cement did.
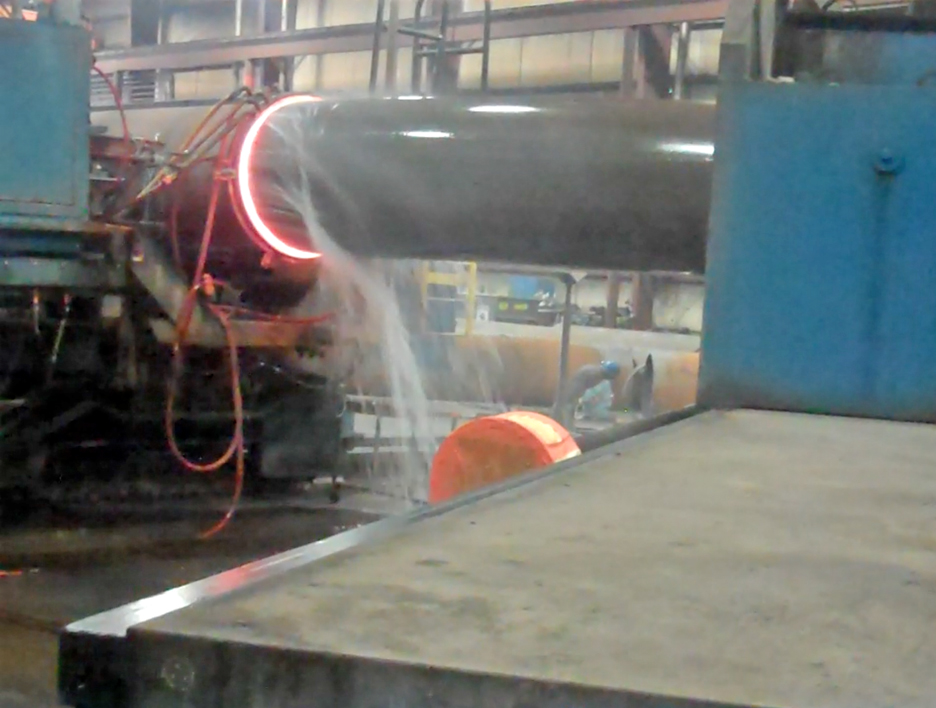
Bending a large pipe at the CBI plant. The glowing band is where the pipe is heated by electric current induction, then bent by the machine at right. Water is sprayed on the already bent portion to prevent over bending.
Tour of CBI Pipe Bending Plant: On Thursday, we carpooled over to a subsidiary of CBI Pipe and Supply in west Ogden that bends large pipes for oil or gas pipelines. The pipes are manufactured straight, but there are times when pipelines have to bend, so this company does the bends. The pipes are extruded and heated using electrical current at a very thin line as a large machine pulls the pipes around at a specific angle. Except for the thin band of heated pipe, the rest is cooled with a water jet. We were shown all through the plant, including how the pipes are tested for strength and shear stress in a lab, how they are annealed in an oven, and how they are painted. Some of the pipes we saw being bent were four feet in diameter.
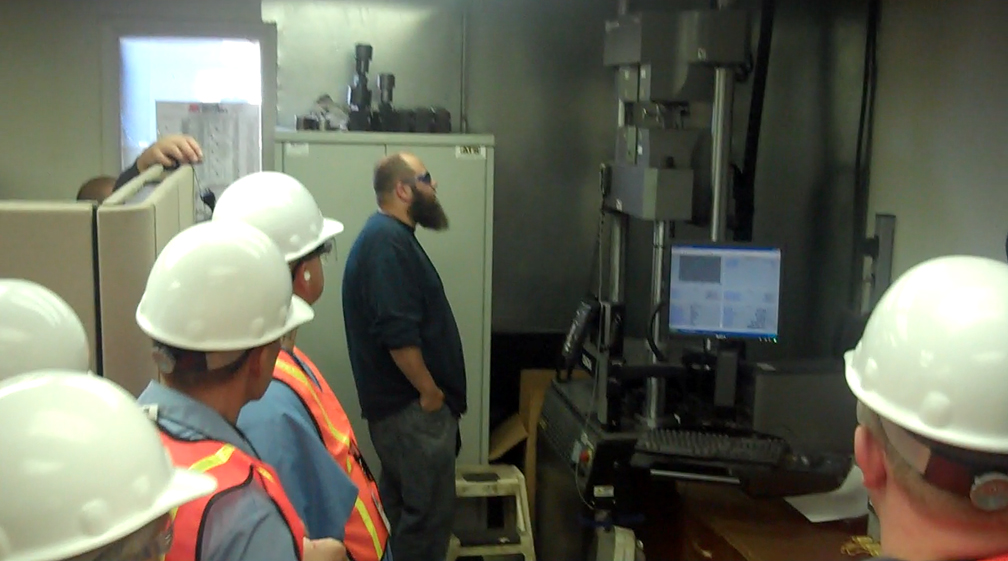
Testing metal samples from the original pipes to determine strength, elasticity, etc.
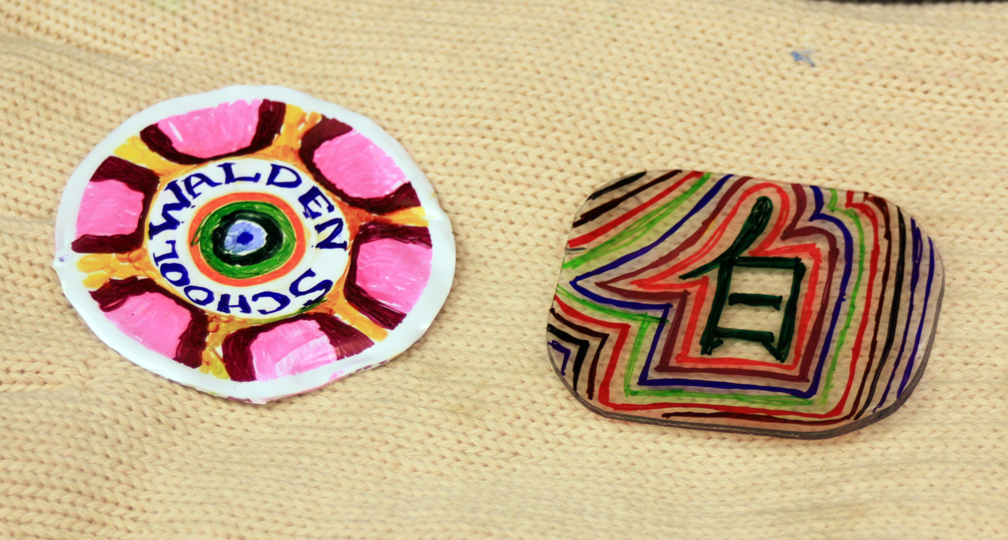
Raku Pottery: This was the most complex thing we did, but also the most interesting from a chemistry perspective. We used a special type of ceramic clay, with higher sand content than usual, to shape small pinch pots. A small 120 volt electric kiln was purchased for this workshop, and the pots were fired in it during the first two days. Then we put glazes made of metal oxides onto the bisque ware and fired it to 900°. On Friday, as our final activity, we took the pots out of the kiln while still hot and placed them into new paint cans filled with shredded newspaper. As the pots hit the paper, it burst into flames. The lid was then placed on the paint can to smother the flames. As the oxygen in the can is used up, the flames pull oxygen away from the metal oxide glaze, reducing it back to a metal. The pots come out with metallic shines. I experimented with various glazes and layering colors on top of each other. My best results were with red copper oxide, tin oxide, and silver oxide glazes. Chromium oxide stayed green and cobalt oxide stayed blue. Tin started pink but turned silvery. Copper went from pinkish to coppery metal, and silver from bluish green to silver-white.
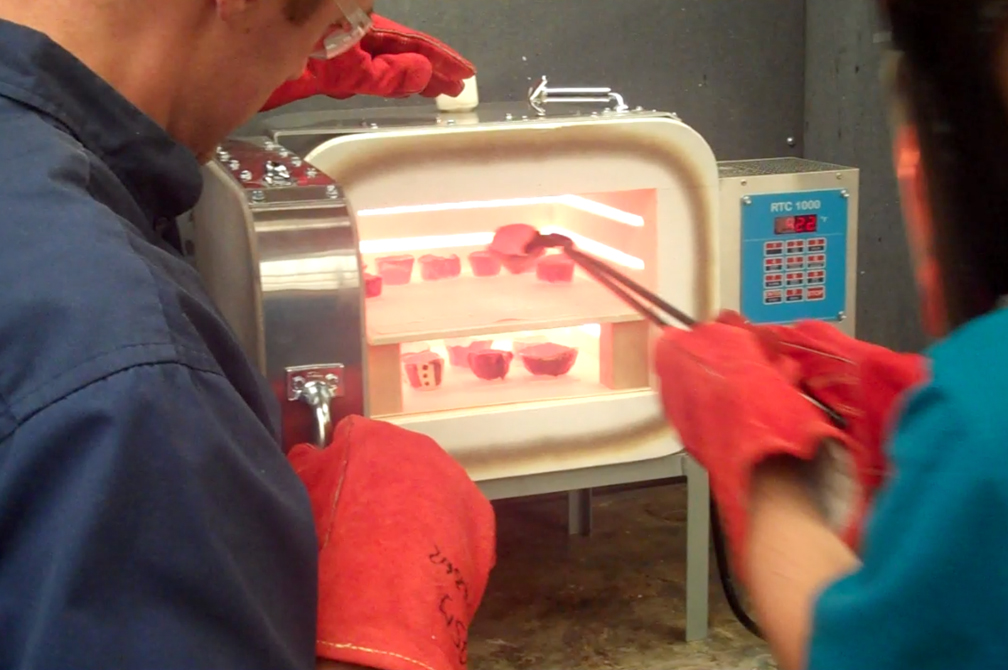
Removing the glowing red Raku pots from the kiln.
These were just a few of the things we did over five days. The workshop has already been extremely useful for me, and I plan to incorporate more of the ideas and activities into my other courses this coming semester. We received a large booklet with lesson plans as well as a DVD. Perhaps I will even propose a semester-long materials science course for next year at Walden School. We ended the workshop on Friday with a nice banquet at the student union building at WSU and were addressed by a colonel in the Air Force at Hill Air Force Base, one of the cosponsors of this workshop.
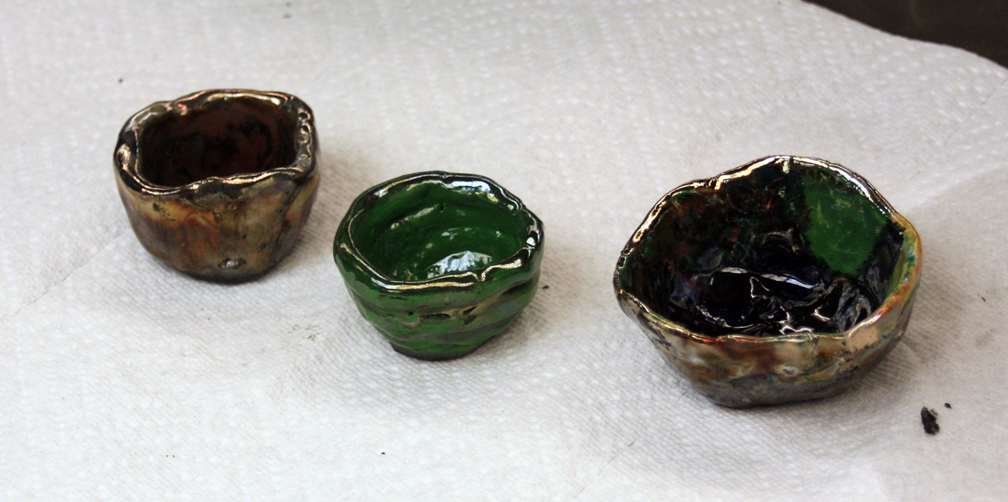
Some of the finished Raku pots. Mine is on the right. It’s not as nice as others because I experimented with layering glaze colors.
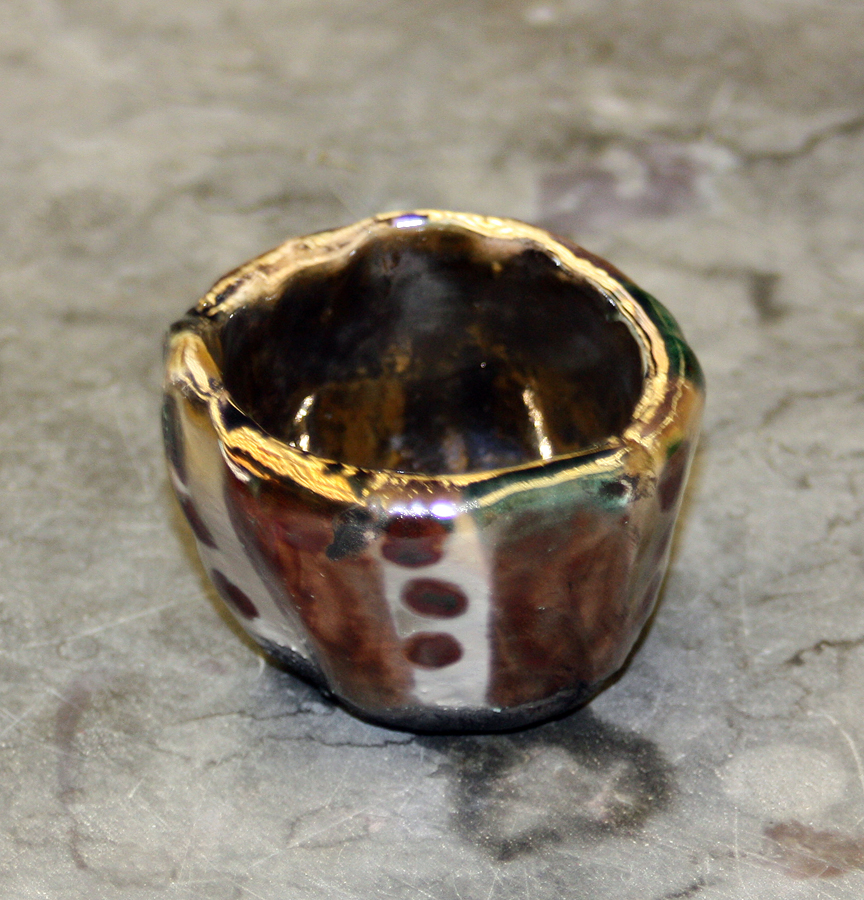
Raku pot using copper oxide glaze, which reduced to a copper metal shine.
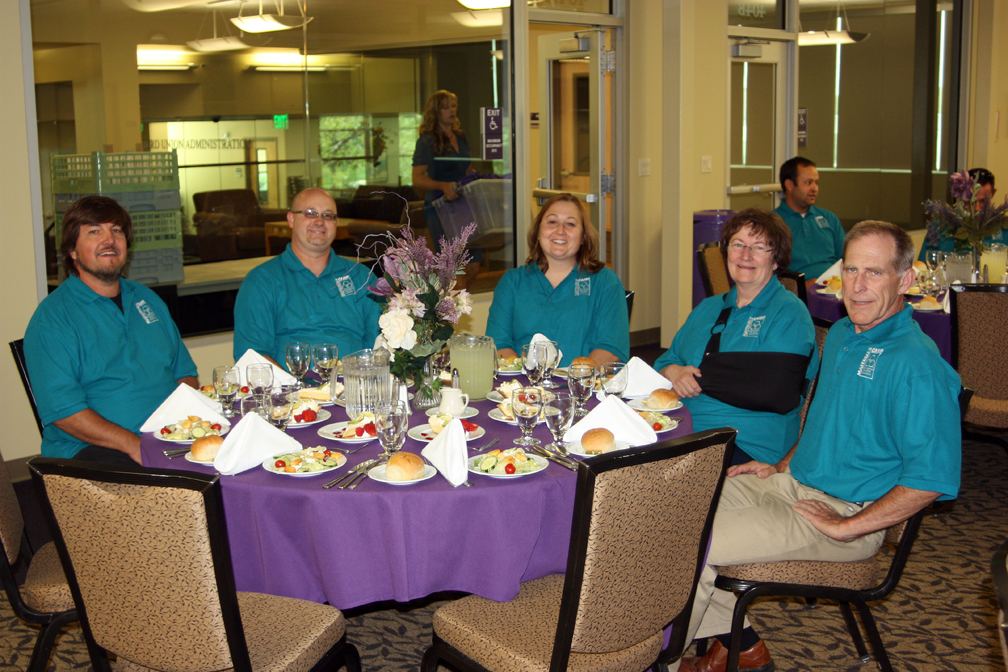
Teachers at the ASM workshop banquet, Friday, August 9, 2013.