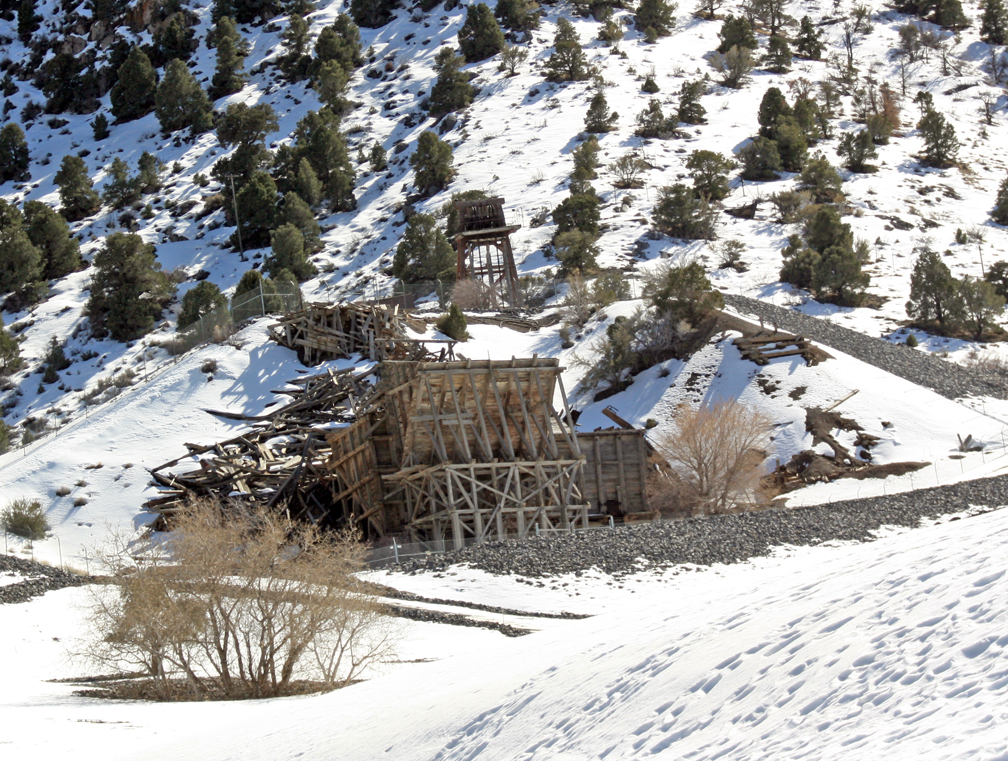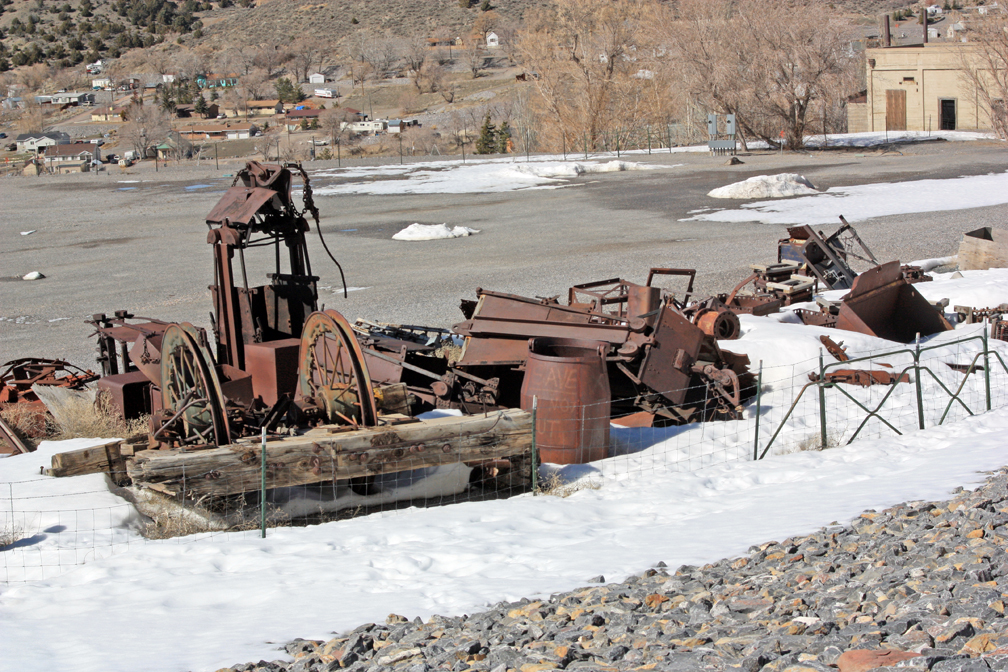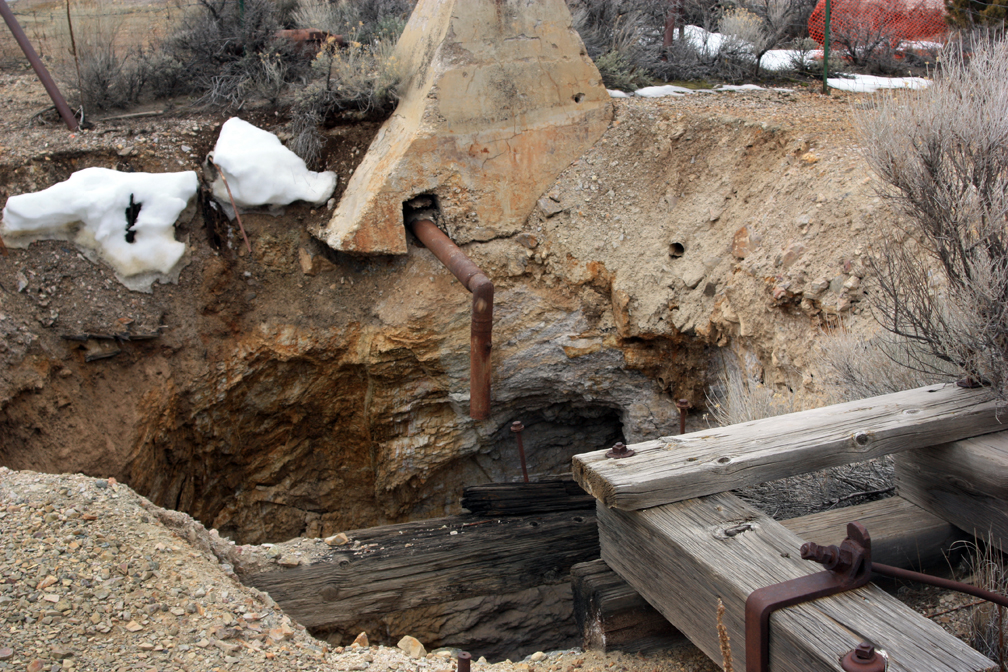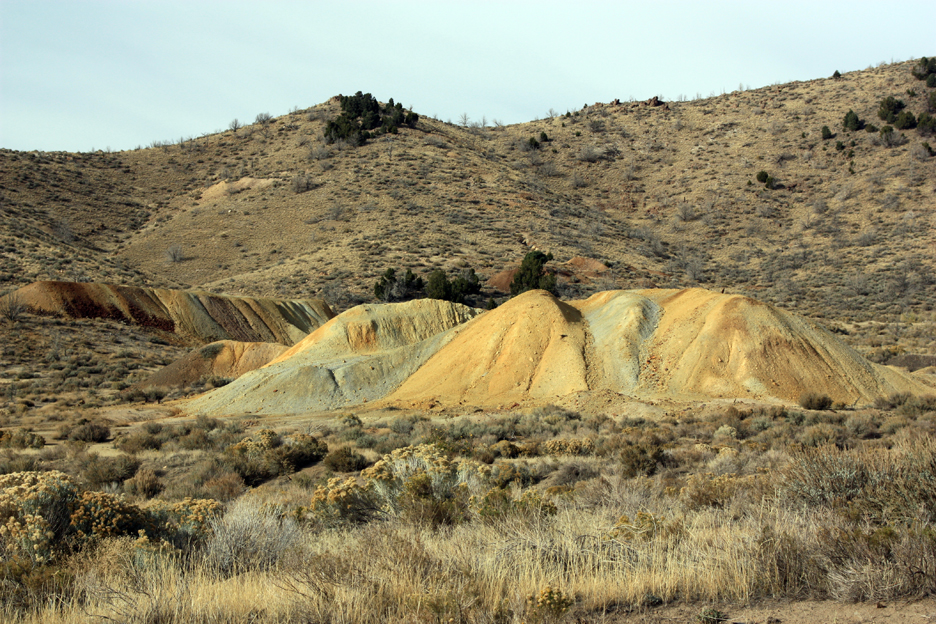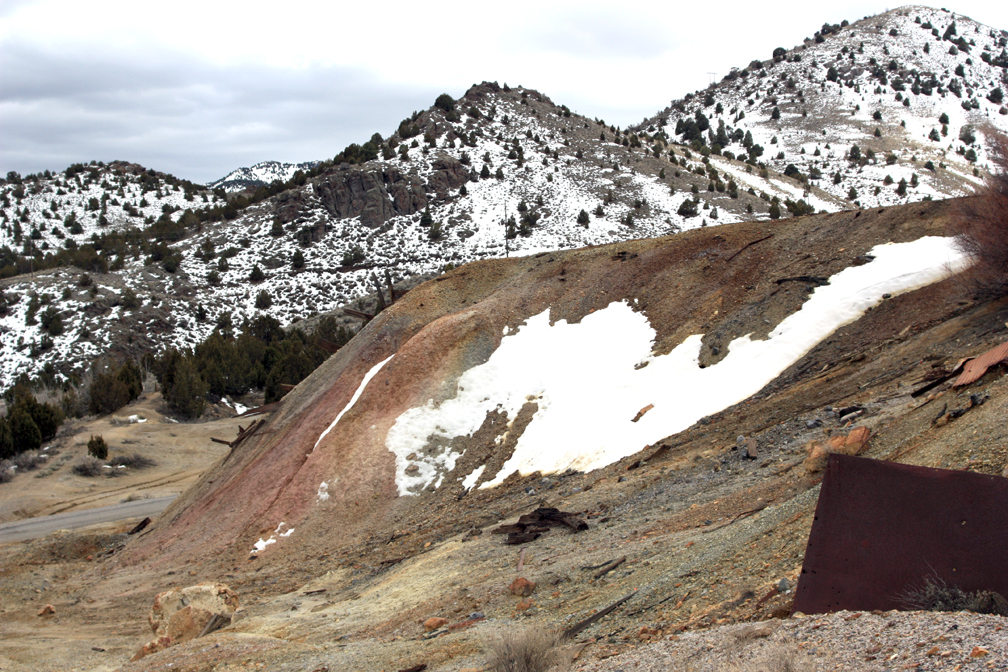
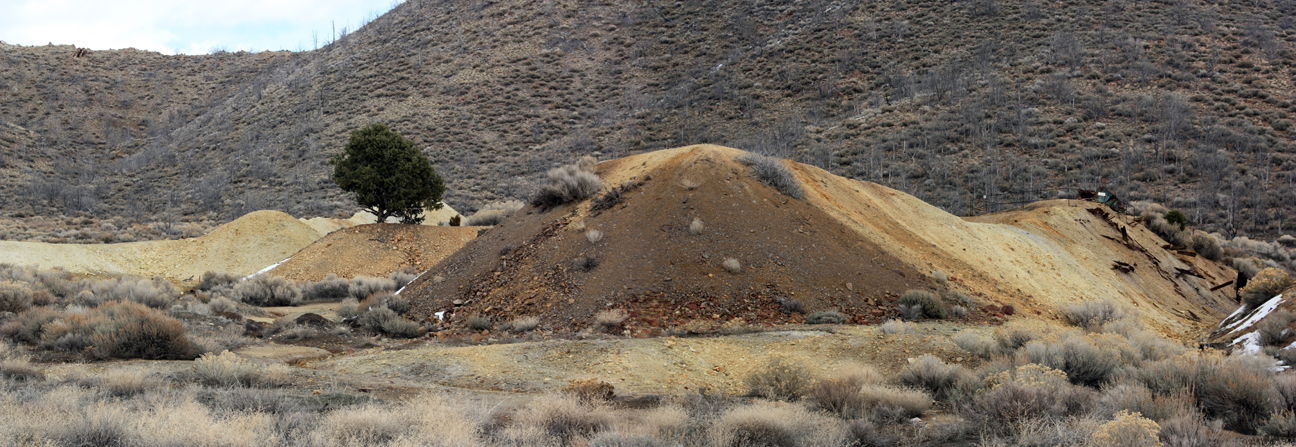
Main waste rock dump at the Tintic Standard Mine.
In this post, we will report results and draw conclusions for our study of soil contamination in the Tintic Mining District. This study was supported by a grant from the American Chemical Society.
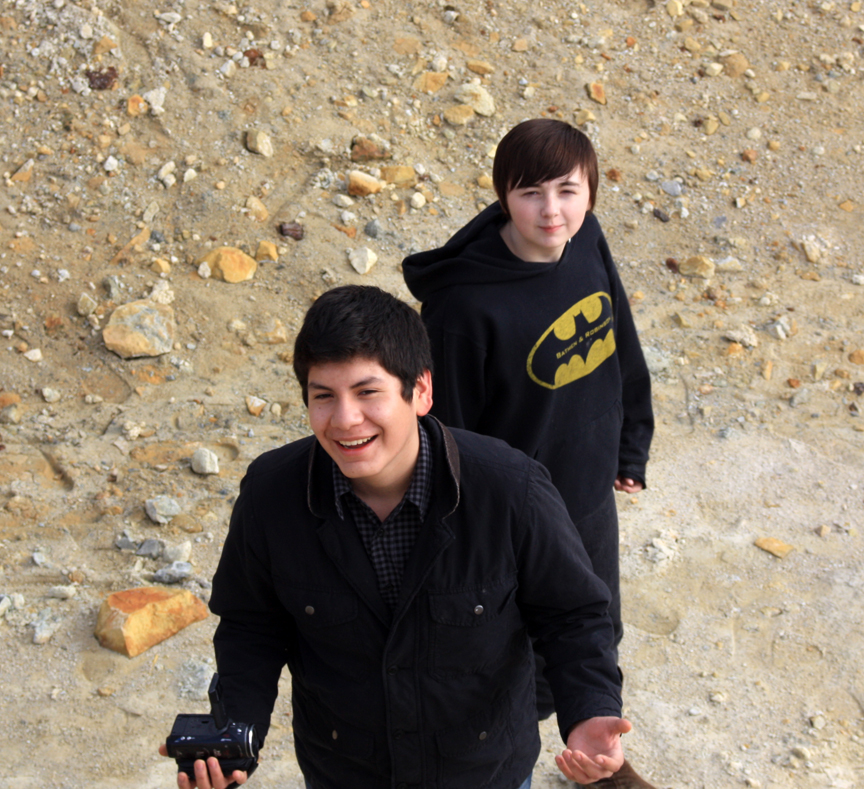
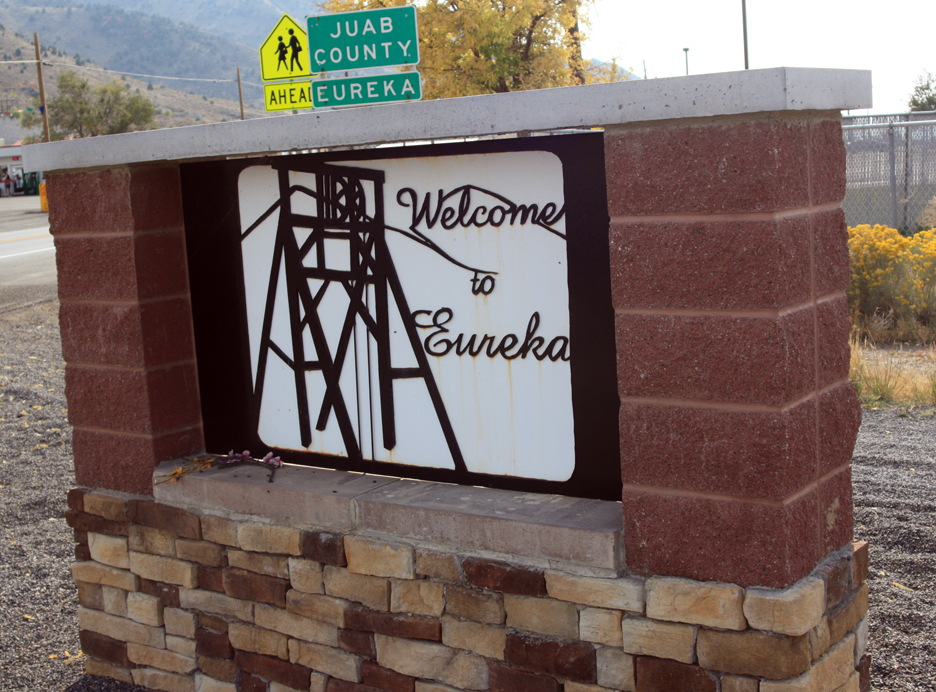
Students from Walden School of Liberal Arts brought back 42 samples of soils from the area in and around Eureka, Utah. Our purpose was to test for heavy metal contamination, especially lead. Previous tests done by the Utah Department of Health and the EPA showed lead contamination to be widespread throughout the town, due to the presence of historic concentration plants in the town and the use of mine waste rock as fill in many lots. Since there are mine dumps on the hillsides south of town, rain runoff also brought lead contamination into the residential areas.
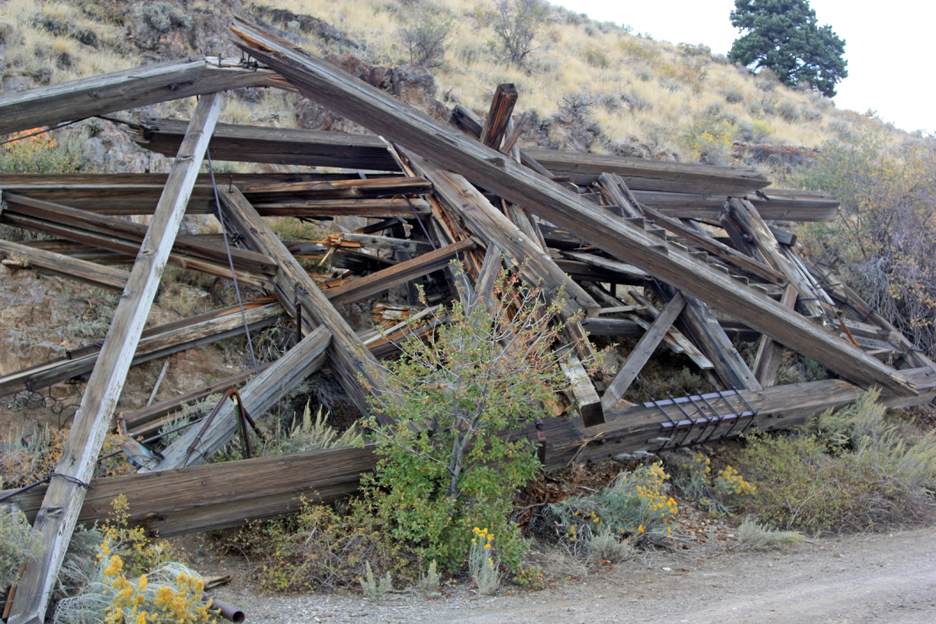
Western side of the Swansea Consolidated mine dump near SIlver City.
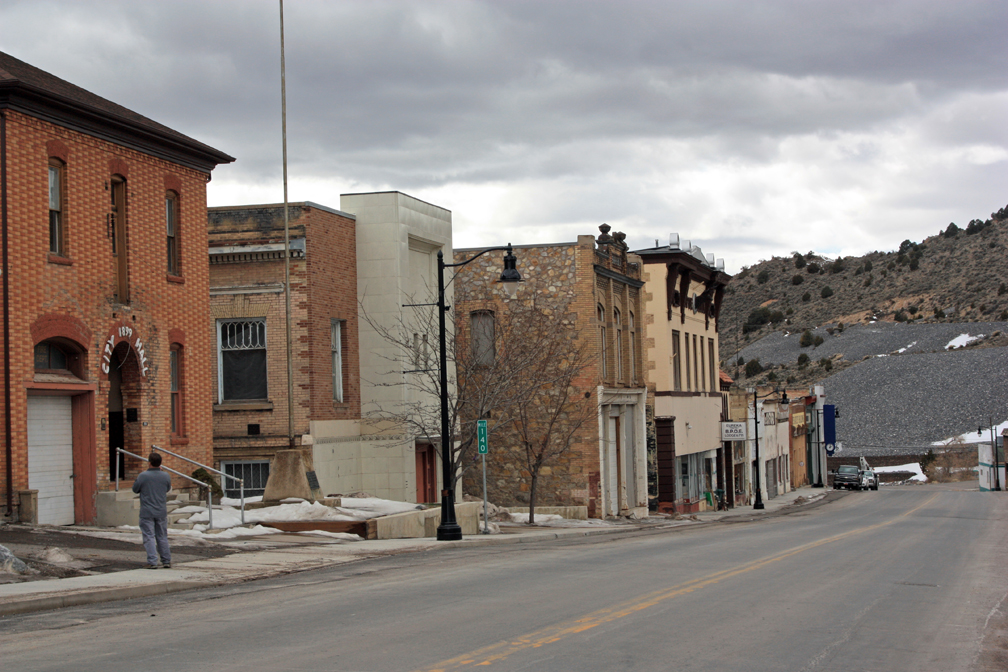
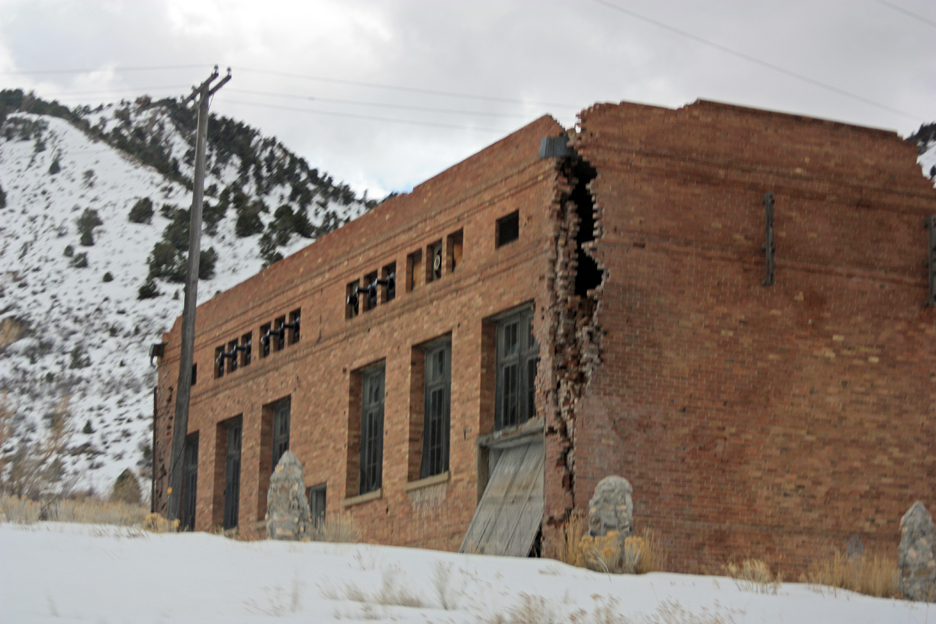
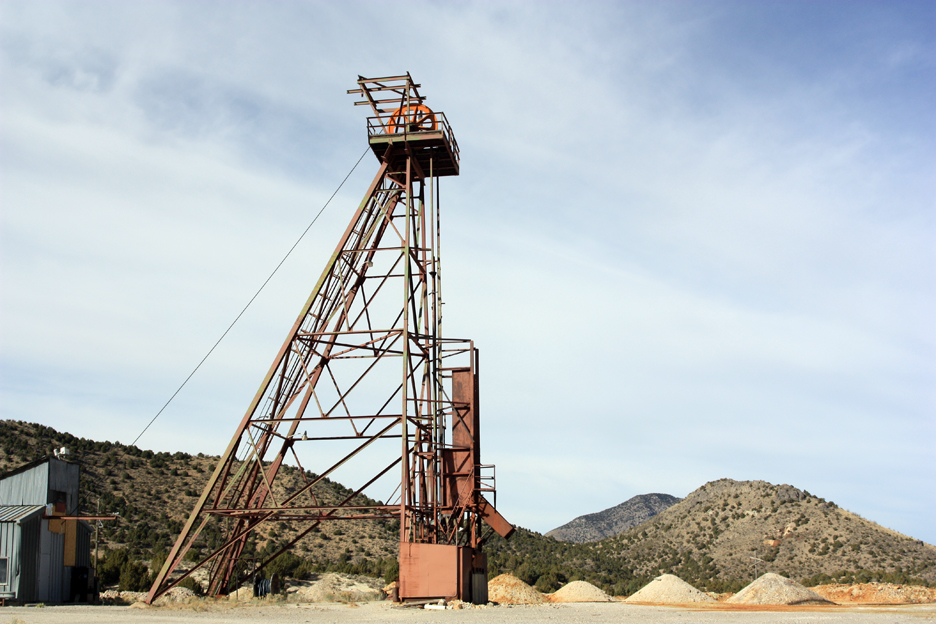
These tests led the EPA to declare the town a Superfund project and spend $26 million to replace soils in some areas of town (but not all). They also placed limestone riprap over the mine dumps to prevent further runoff. The process took ten years and completely changed the look of the town, damaging or destroying several historic landmarks along the way, such as the headframes for the Eureka Hill and Gemini mines. Two landmarks, the Bullion Beck headframe and the Shea building, were restored. The rest have been left in ruins.
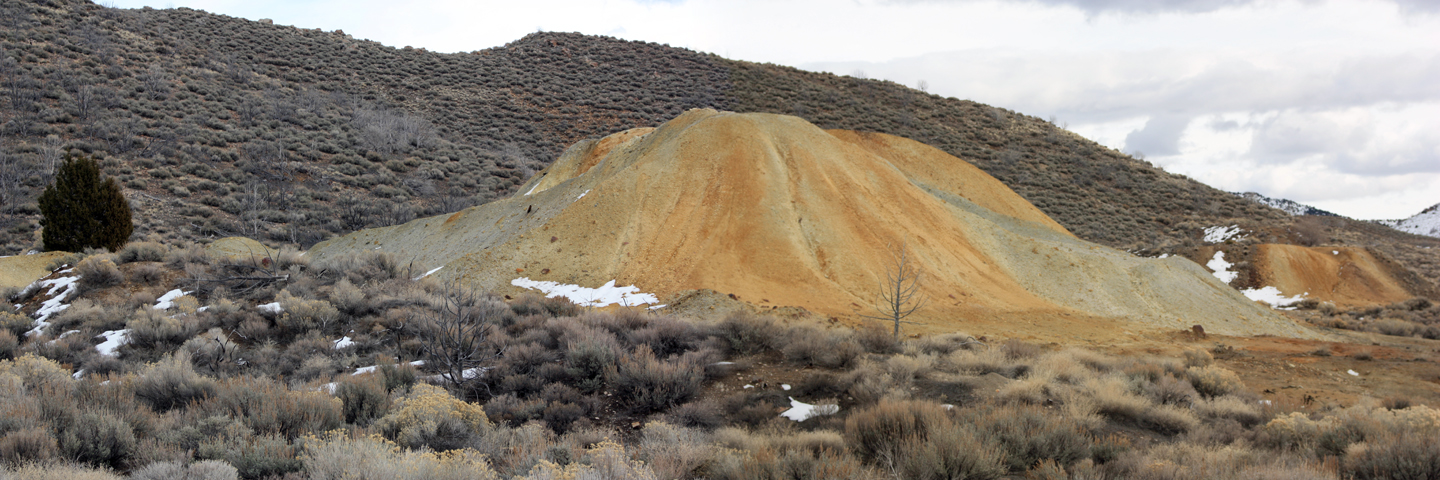
Middle section of the Swansea Consolidated mine dump near Silver City.
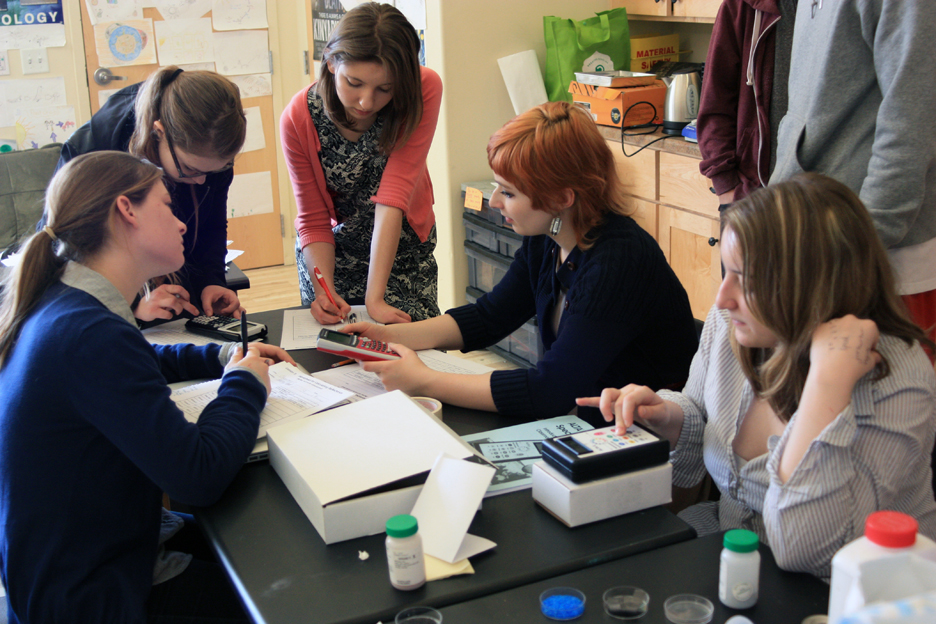
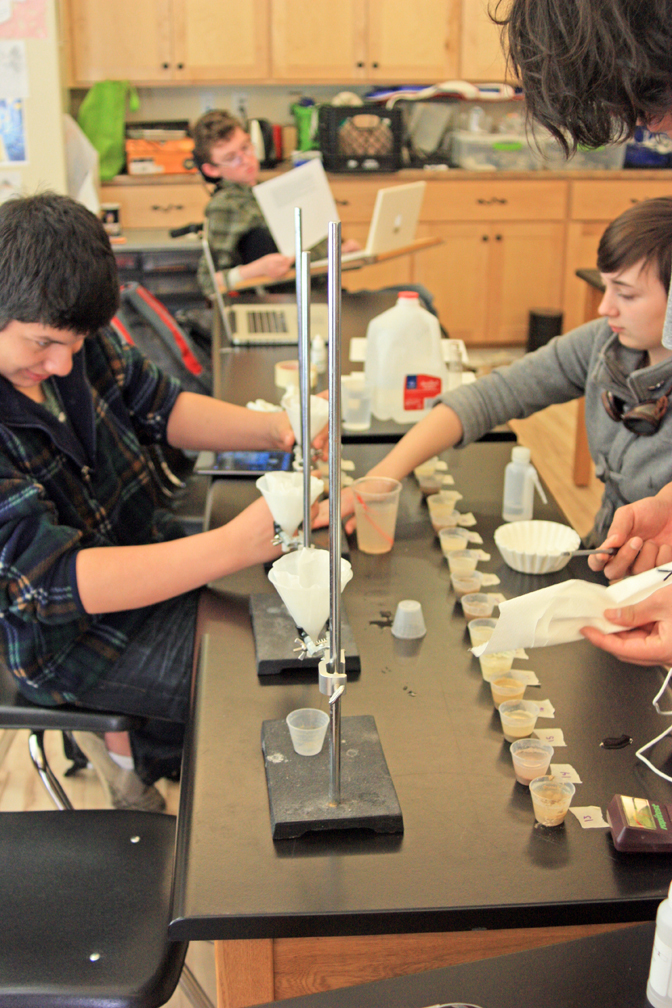
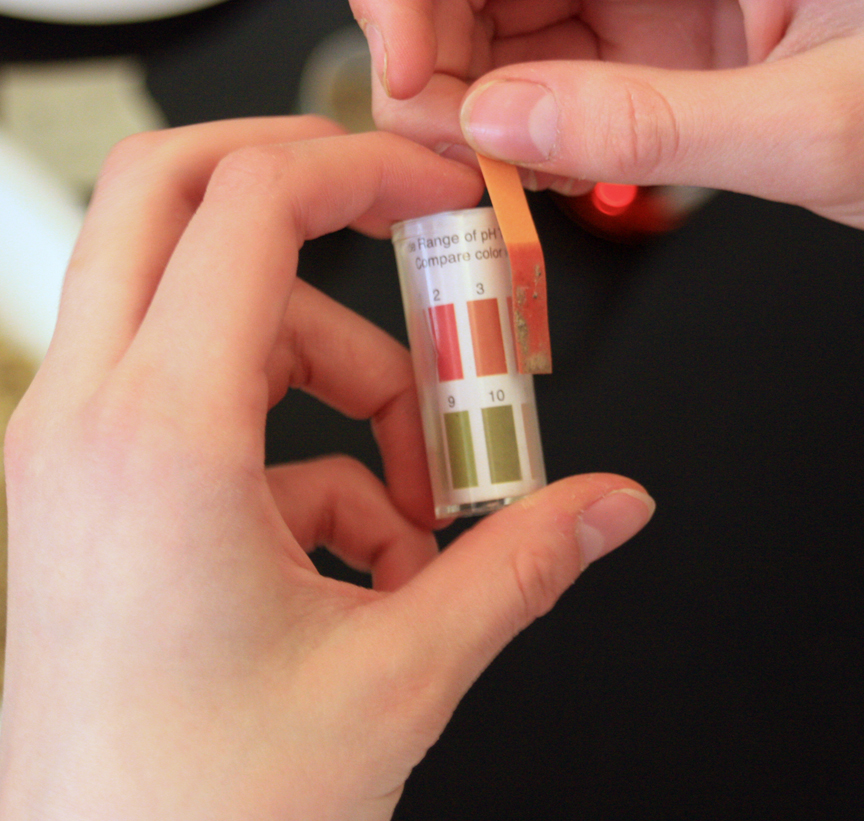
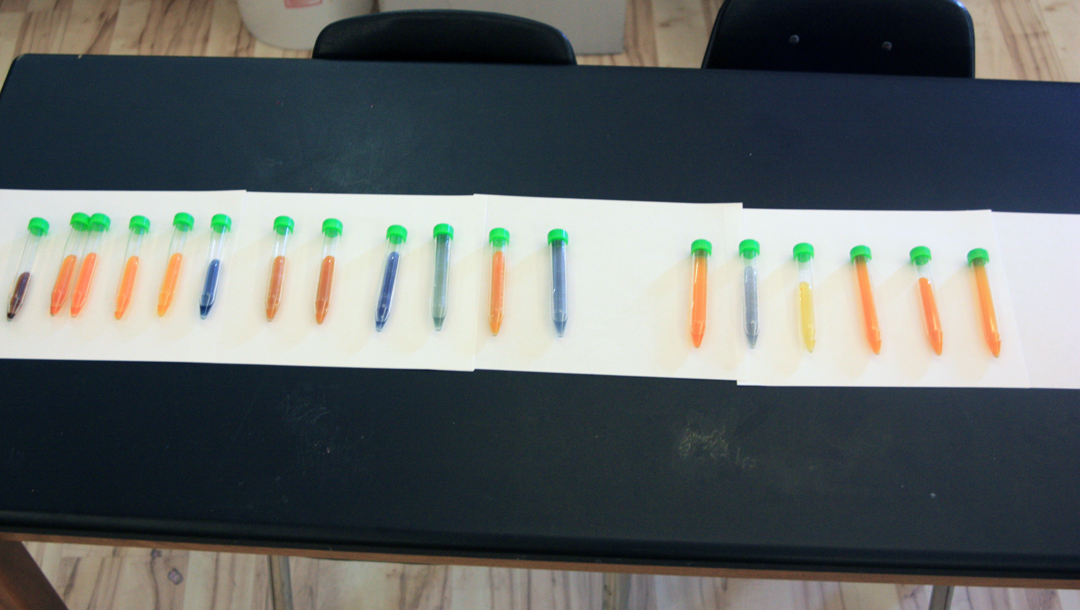
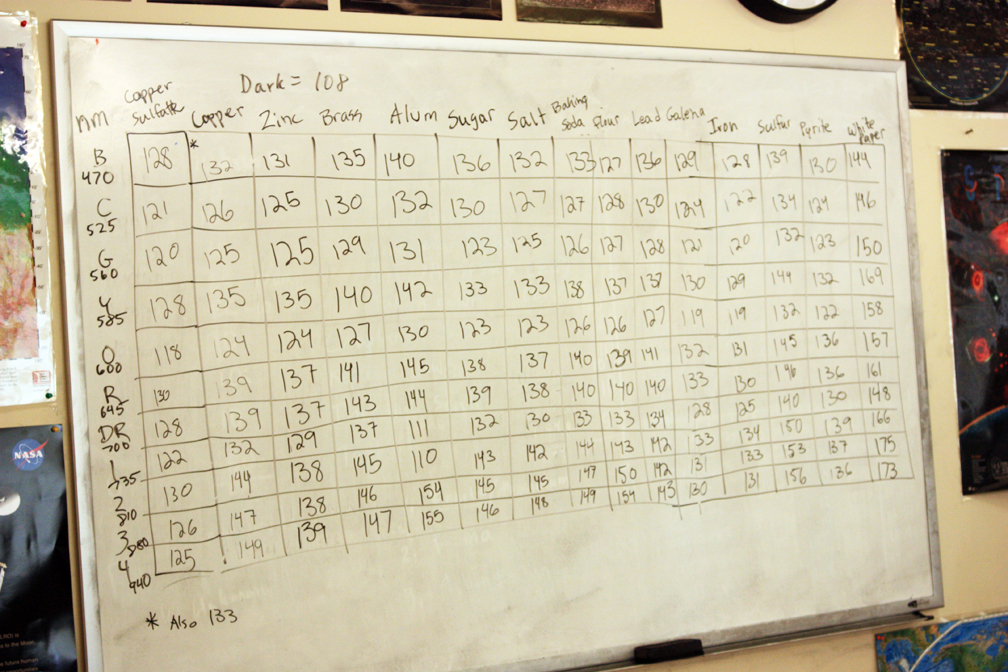
All of the tests we conducted were put into numerical form and entered into a spreadsheet so that we could compare the results. We used an ALTA II reflectance spectrometer to measure reflected light at eleven wavelengths, including four infrared wavelengths. We also tested the pH of the samples using several methods, including universal test strips, a garden soil test kit, and a pH meter. We tested for lead using a sodium rhodizonate solution, which changes from orange-red to pink in the presence of lead in neutral soils and to green or blue in the presence of lead in acidic soils. Please see our previous post for details on these tests. Since the rhodizonate test was qualitative, we assigned numbers depending on the color of the final solution so that some comparison could be made.
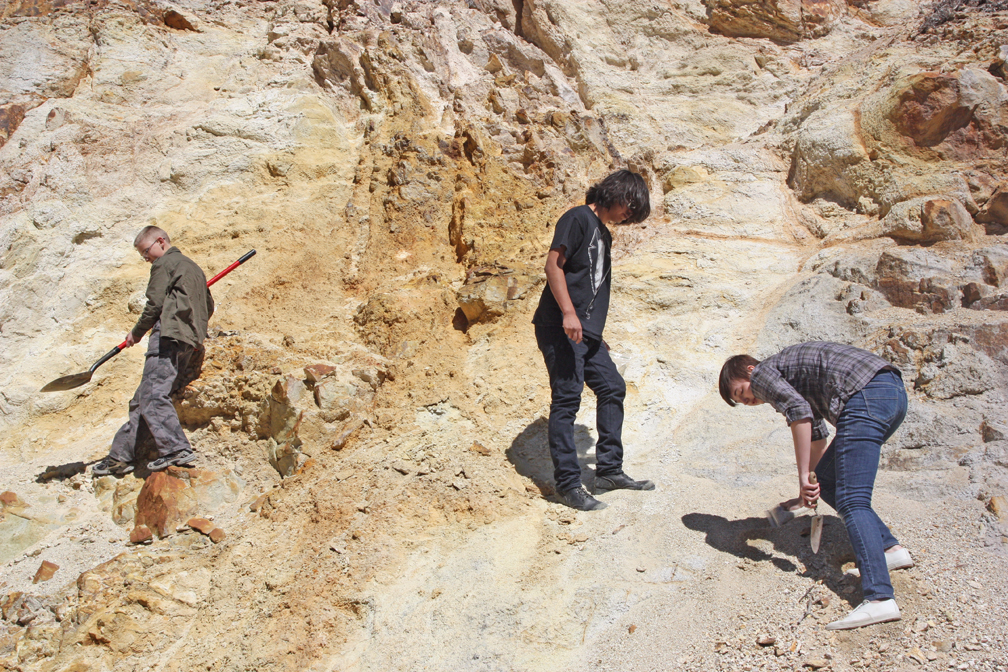
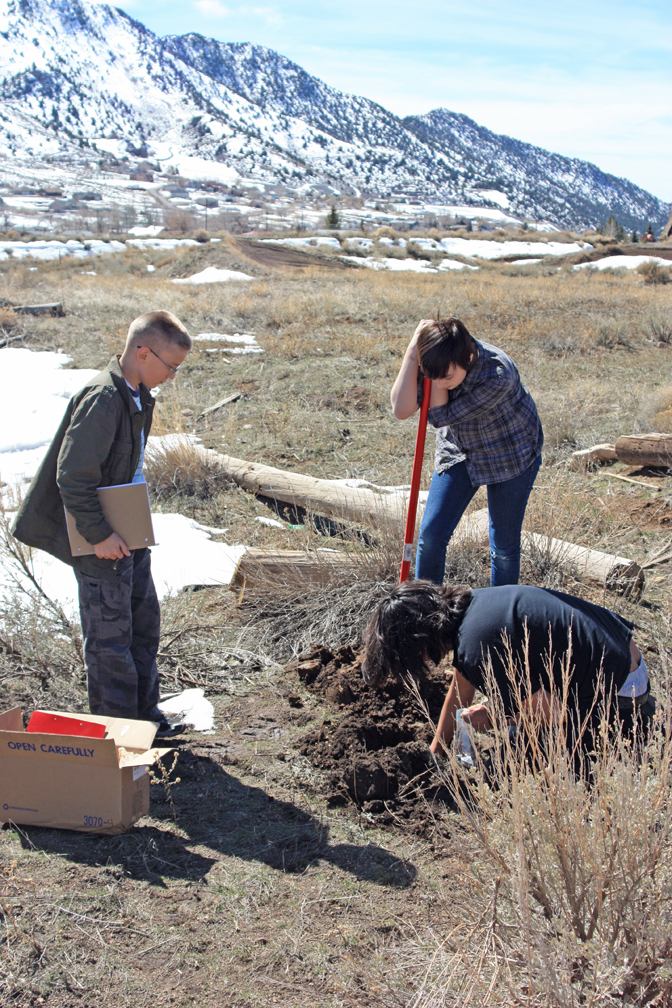
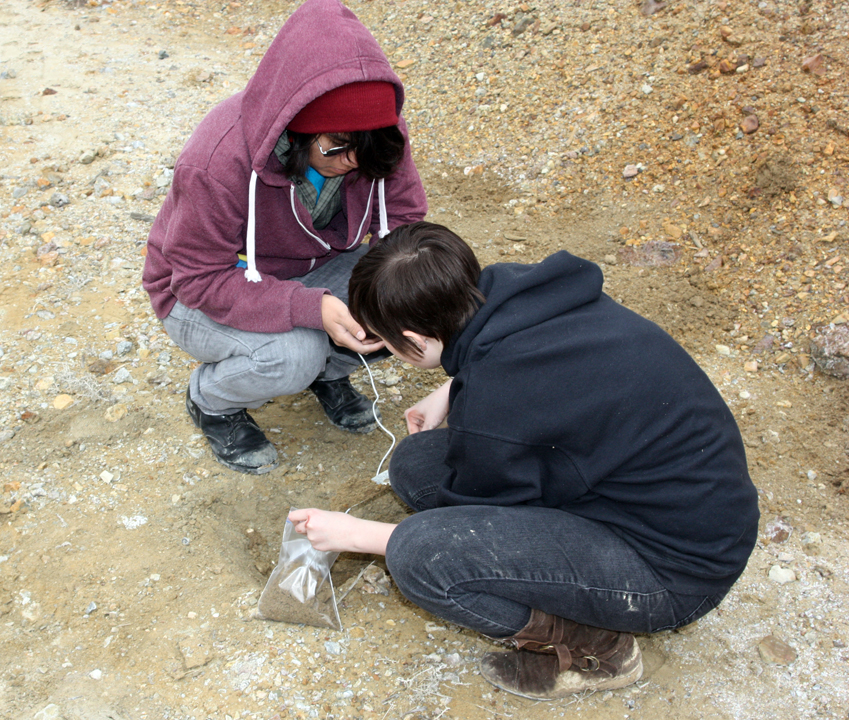
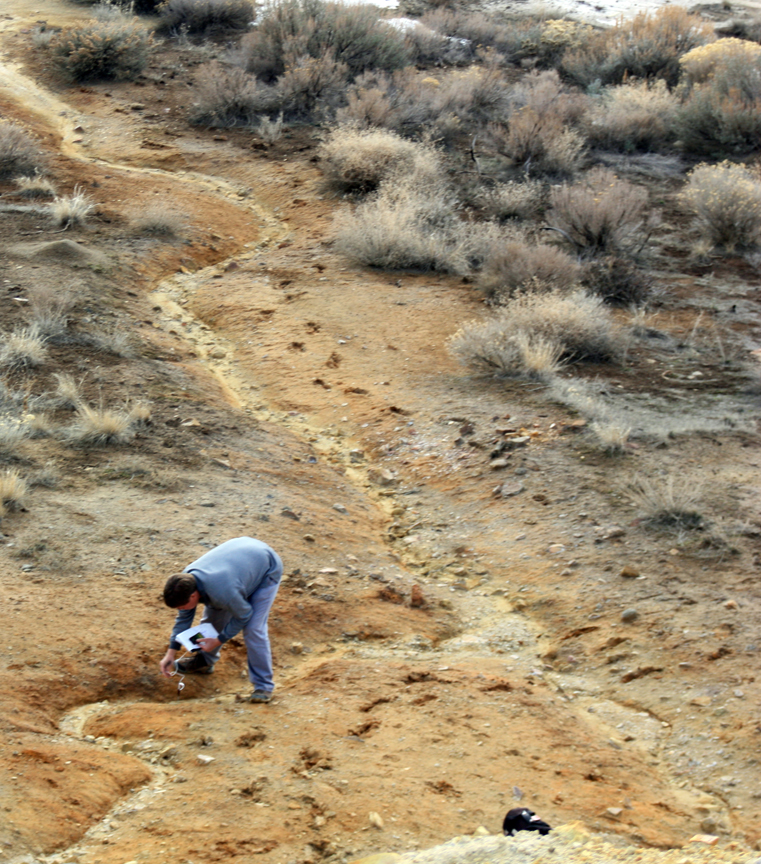
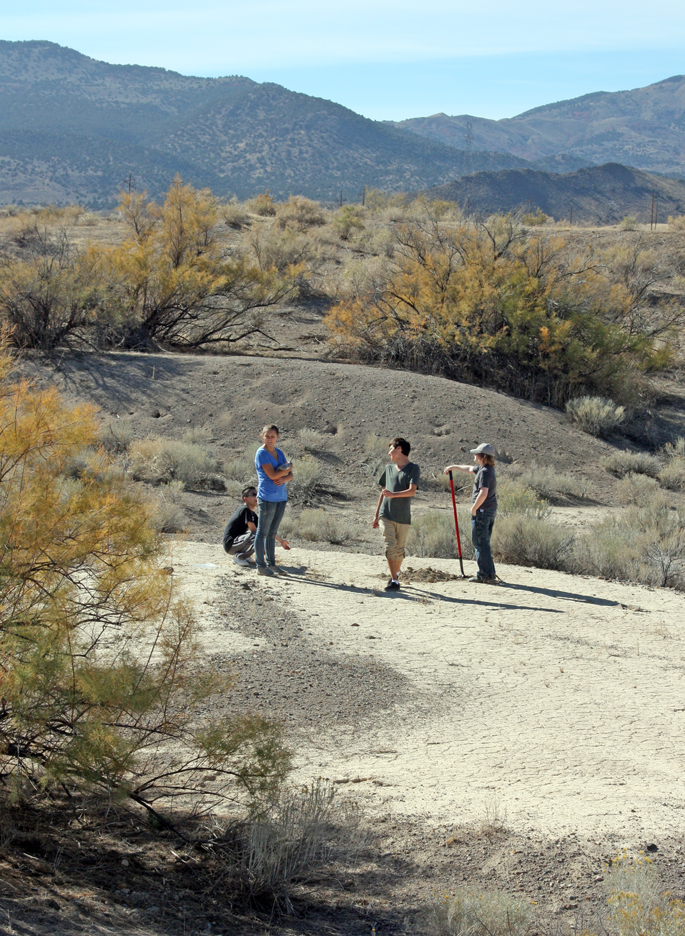
For the samples, we selected ten areas inside the town of Eureka, including some where the soil has been replaced and others where the soil is original. We tried to pick areas that were representative of the town as a whole. At each site, we sampled the surface soil and soil about six inches below the surface. We also sampled 12 sites outside of town, including areas away from town as controls and areas on or near exposed mine dumps, such as those from the Tintic Standard, Swansea Consolidated, and Tesora mines. We also took samples from gullies or washes downstream from mining areas and dumps, and from an exposed ore body (which has not been mined or processed) at a road cut along U.S. Highway 6.
Test Results:
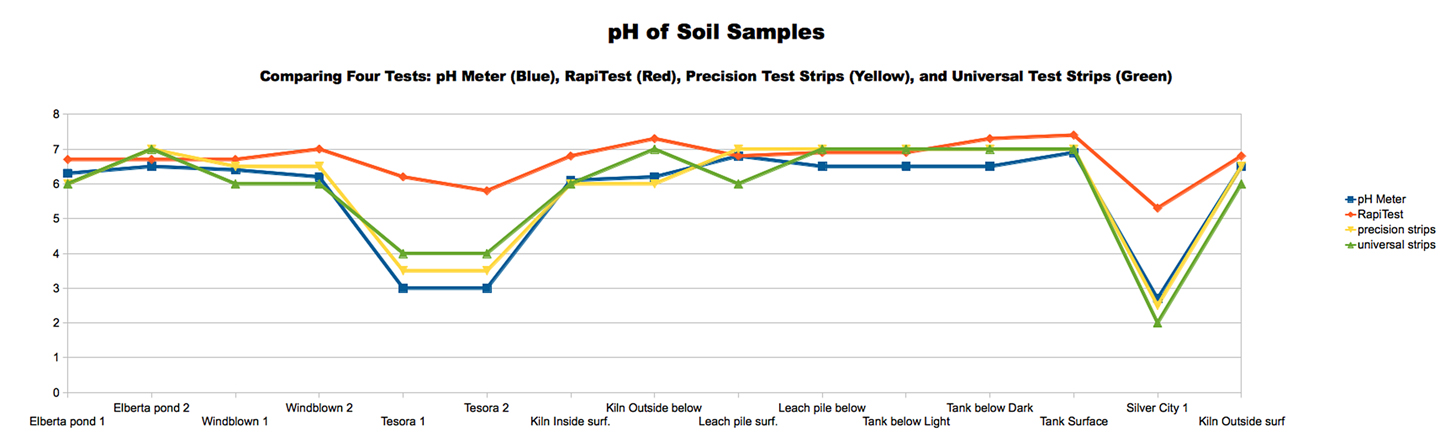
Chart 1: Comparing Different pH Tests of Soil Samples. The readings taken with our portable pH meter provide the most consistent results (and can be done easiest in the field).
As you can see from Chart 1 shown here, of the different methods we used to determine the soil pH, the pH meter was the most sensitive and consistently accurate. It was also easiest to use. It showed that most of the samples, were slightly acidic (between 6 and 7), but the samples taken from mine dumps and the areas immediately downstream were extremely acidic; in fact, some samples had a pH too low for our meter to read, which had a low limit of 2.5. Although not shown on this chart, the samples taken inside Eureka on our fourth collection trip all showed pHs near neutral (6 – 7).
Our lead test showed no discernable lead inside Eureka, even in soils that had not been replaced by the EPA. This is probably because our test is not sensitive enough for low lead levels. It becomes hard to distinguish the original color of the rhodizonate from the natural color of the soil unless there is enough lead present to create an obvious color change. In Chart 2, low levels of lead correspond very well with neutral pH soils.
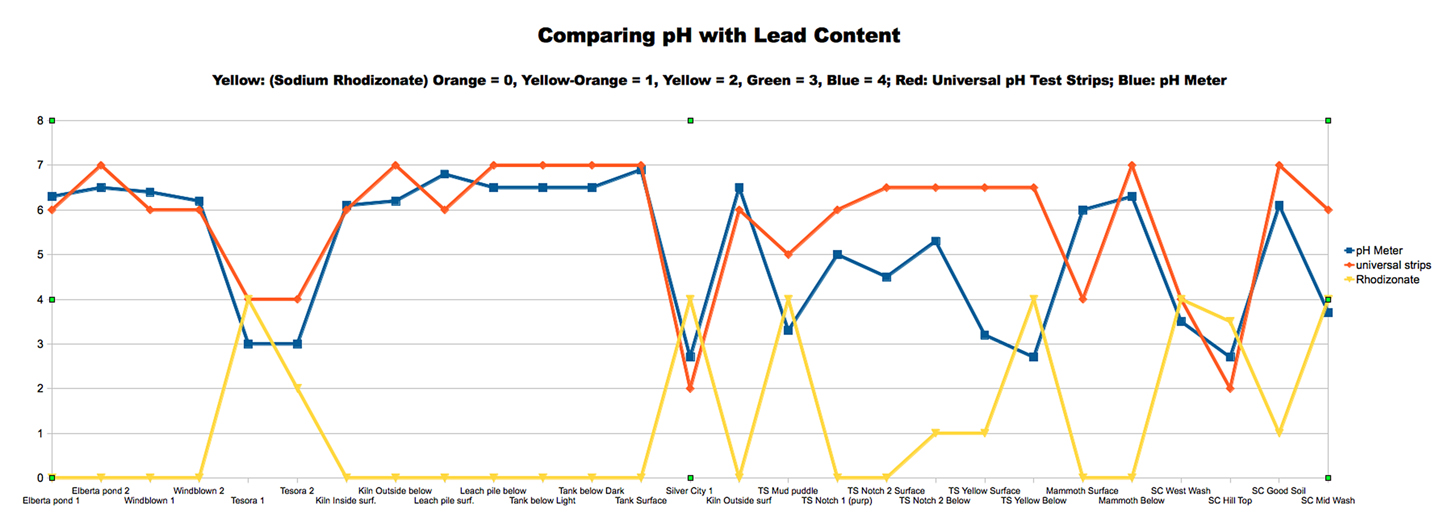
Chart 2: Comparing Soil pH with Lead Levels. The lower the pH (more acidic) the soil samples were, the more lead was present with a correlation coefficient of rho = -0.876.
The most interesting result of our study was to compare pH with lead levels. Chart 2 shows that the highest lead levels were found on or immediately downstream from mine dumps, which correlated very well with low pH levels with a correlation coefficient of rho = -0.876. Mine dump soils had high lead content and were highly acidic. Of course, this doesn’t imply causality: the high acid doesn’t cause lead, and the high lead probably doesn’t cause the acidity, but if one is present, so is the other.
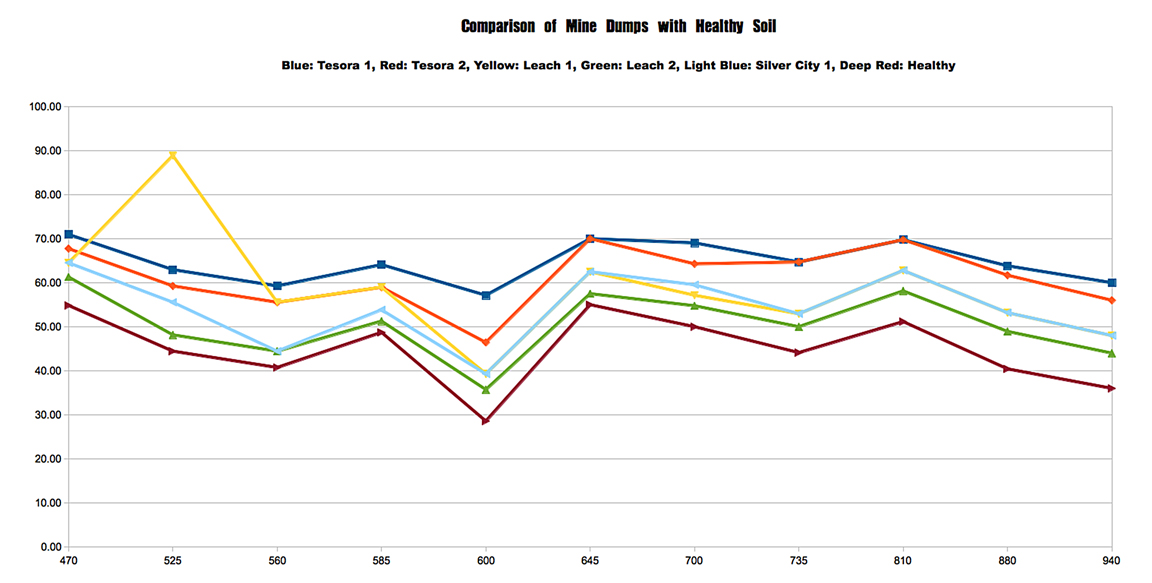
Chart 3: Comparing Soils at Mine Dumps with Healthy Soil Using the ALTA II Reflectance Spectrometer. Healthier
soils were darker and richer in humus, whereas mine dump soils were pale and yellowish.
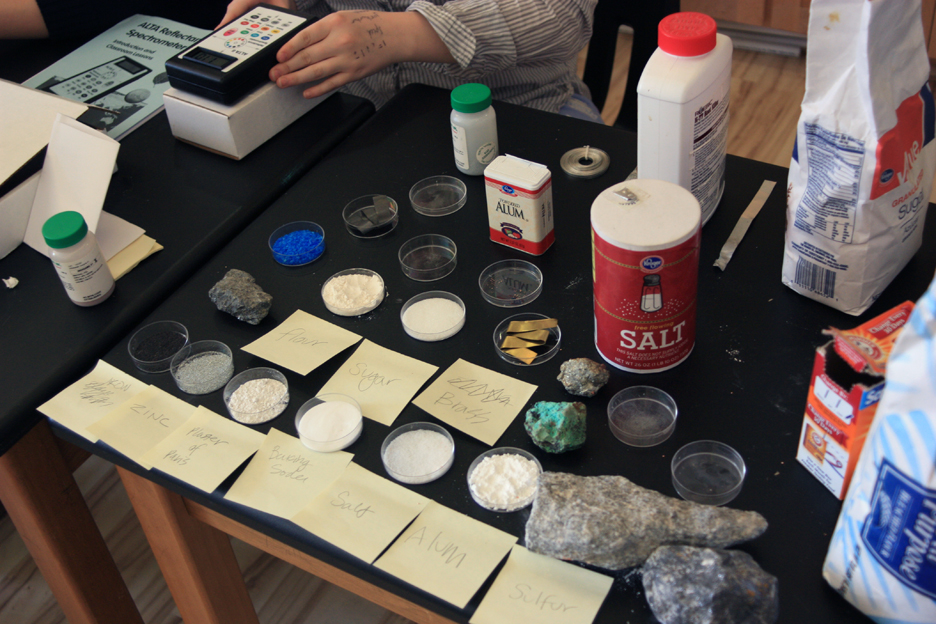
In Chart 3, the reflectance spectrometer tests were inconclusive as far as detecting a signature for lead. We compared the results shown with samples of pure lead, pure galena (lead sulfide), and silver-lead ore. There were no obvious wavelengths that gave a definitive fingerprint for only lead.
The one useful result of the spectrometer tests was to confirm the overall health of the soil samples; those with lower percent reflectance overall were darker, richer, more healthy soils with more plant life growing. The lighter soils had less plant life and higher overall reflectances. The soils at mine dumps were yellowish to light purplish due to the presence of sulfur compounds, and these also had no plant life, lower pH, and higher lead.
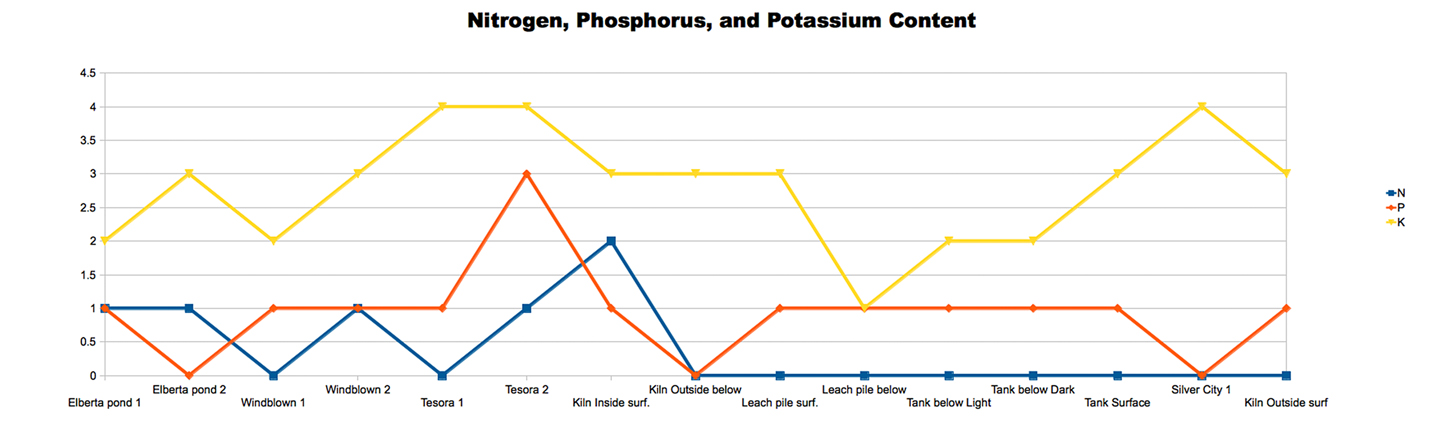
Chart 4: Comparing the Levels of Nitrogen, Phosphorus, and Potassium in Soil Samples. The nitrogen and phosphorus tests gave no predictable results, whereas the potassium test showed higher levels of potassium in mine dump soils with high lead content (rho = .687).
Chart 4 shows the tests we conducted on soil nutrients. The nitrogen and phosphorus tests were inconclusive, and are probably due to the poor quality of the garden test kit we used. The potash (potassium) test did show higher potassium in the mine dump soils where lead levels were also highest, although the correlation was only moderate (rho = 0.687).
Conclusions:
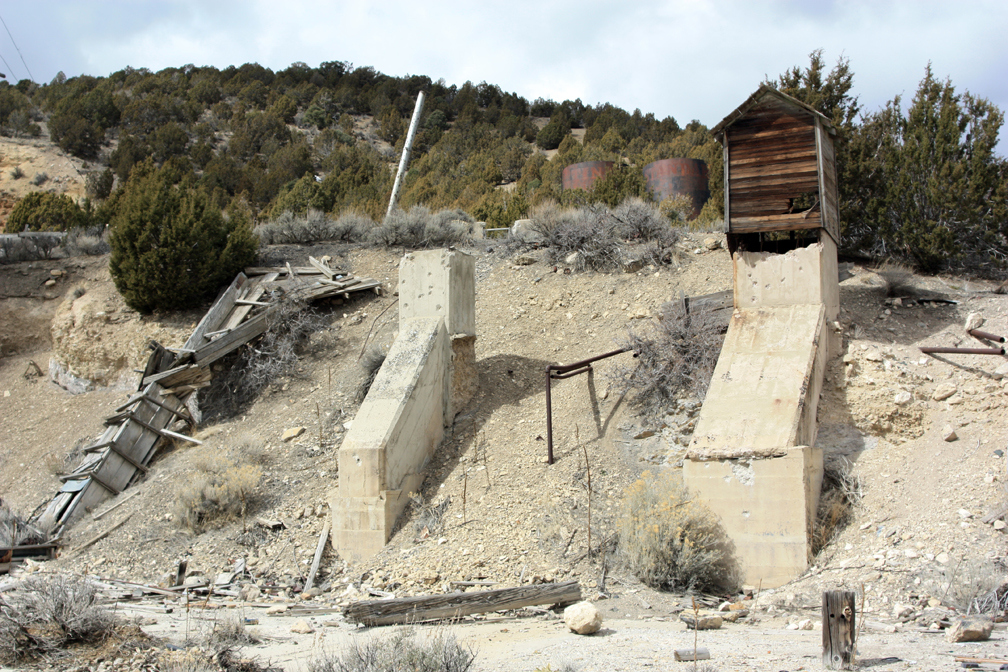
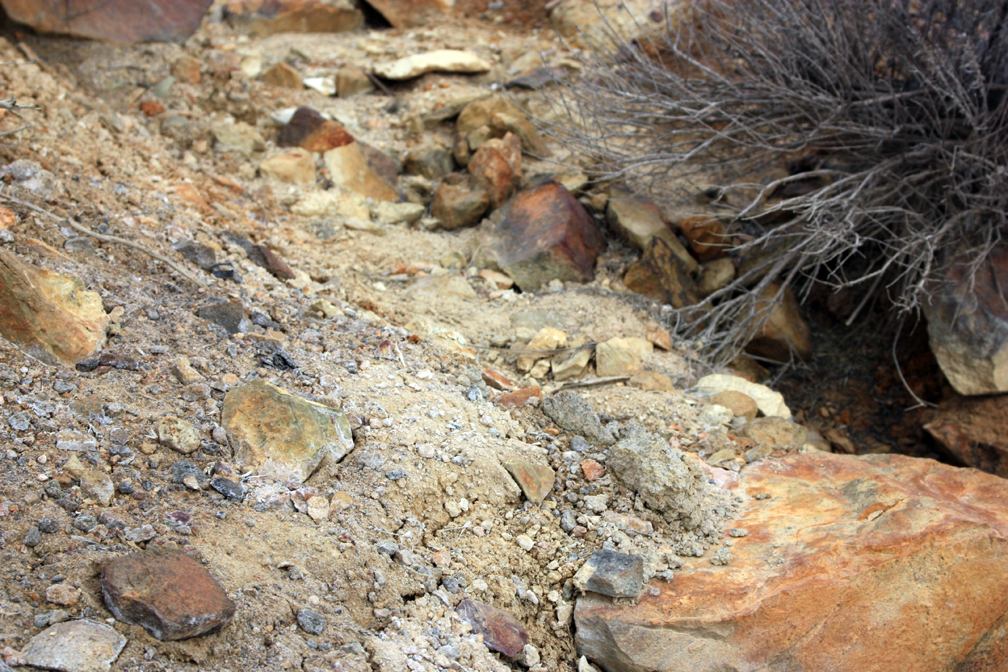
A visual inspection of the mine dumps outside of Eureka, Utah in the Tintic Mining District shows that the waste rock and soils are highly contaminated. No plants grow on the dumps or in the gullies immediately below them. They are stained a bright yellowish-orange, and soils in the nearby gullies have layers of red, yellow, and even green. Overall, they are lighter and less rich than nearby soils with plant life. Our tests show that these mine dump soils are acidic and have high levels of lead contamination.
Similar mine dumps were located at the west end of town (around the Gemini and Bullion Beck headframes) and south of town (Chief Consolidated and Eagle and Bluebell mines). If the same pattern of contamination occurred there as what we found in the Swansea, Tesora, and Tintic Standard dumps, then it is likely that the soils downstream in the residential areas of town were also contaminated by lead and sulfur compounds. We did not find evidence of this in our tests of original soils inside town, but our test was not sensitive enough to find the lowest levels of lead. Soil pH throughout the town was slightly acidic, which may indicate sulfur or even lead content. We were not able to get the data from the original EPA tests.
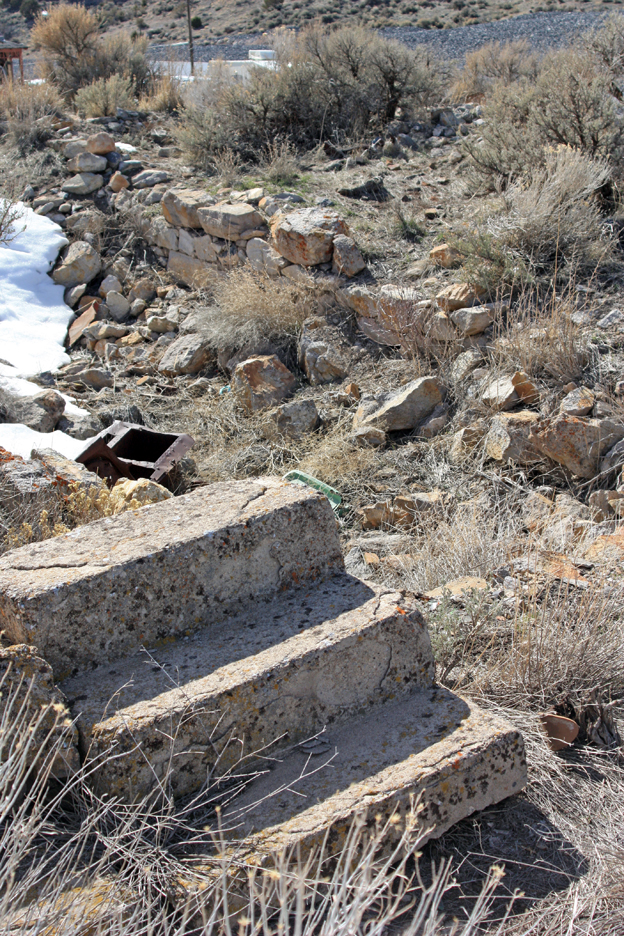
Soil discoloration in the wash west of the main Swansea mine dump at Silver City.
Both pH and potassium content appear to be well correlated with lead content, with pH having a particularly high negative correlation (-0.876). Perhaps pH can be used as a marker, since it is easily measured. Where lead is suspected, a pH reading showing high acidity would indicate a strong possibility of lead. It would be interesting to see if the two measurements decouple as one travels further downstream from the mine dumps along washes and gullies. Do the lead and the acid travel the same distances?
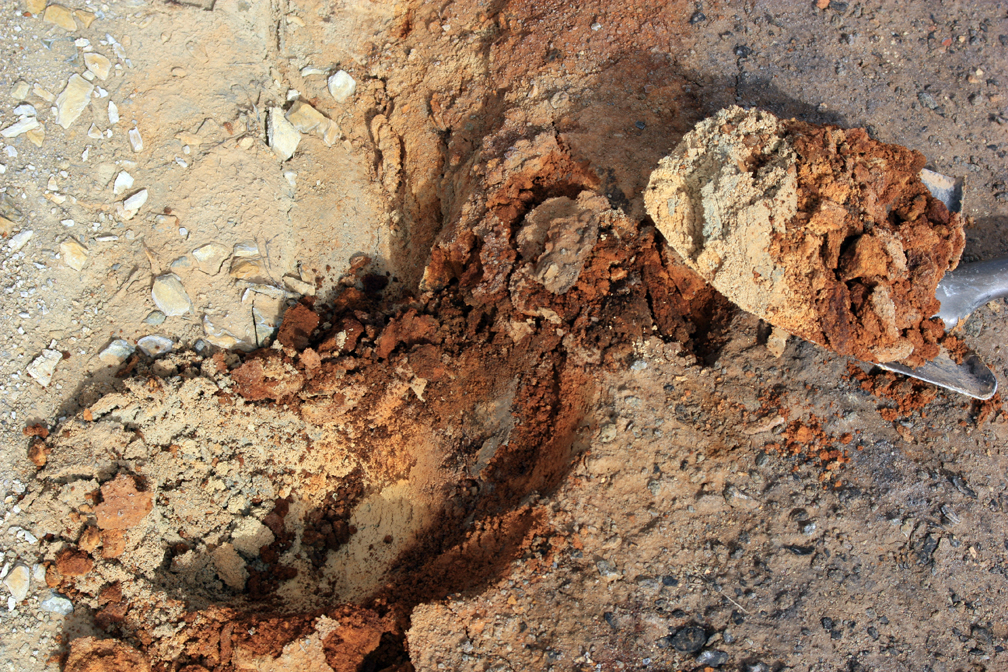
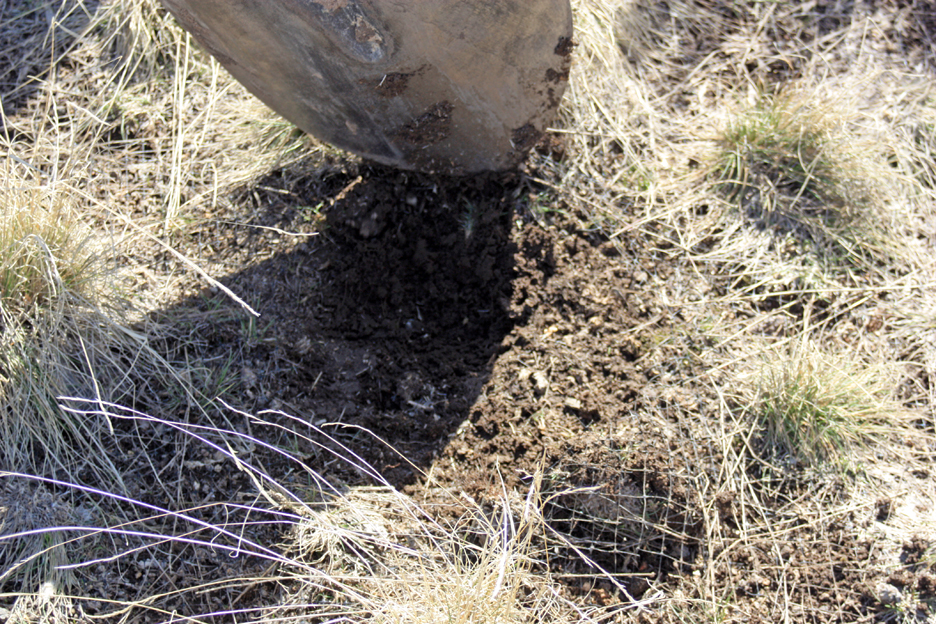
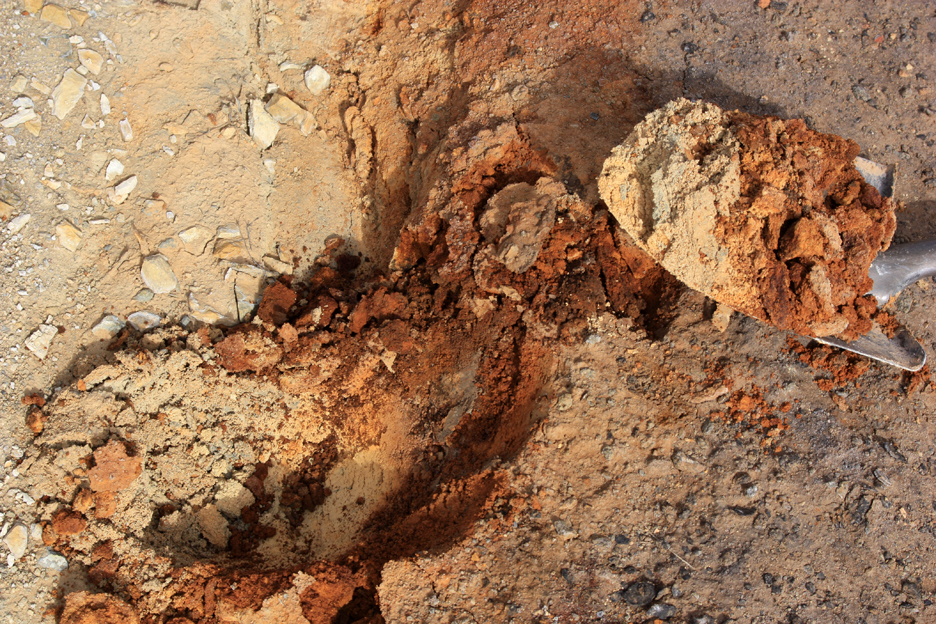
Soil layers showing different types of contamination, in the middle wash downstream from the Swansea mine dump.
Much remains to be tested. We have some additional grant funds that we will use to send four samples to an outside lab for detailed element analysis. I also hope to take all our samples to a local university and use an X-ray Fluorescence Spectrometer or Raman Spectrometer to get an accurate and precise readout of the lead levels and other heavy metal content. We need to determine the amount of sulfur compounds in the soils, and how that correlates with pH. We also need to pass our samples through a soil sieve and measure the relative sizes of particles and the amount of humus in each. We should test the mine dump soils to see if plants will grow in them compared to the other samples. Finally, we need to return to the site and collect more samples of other mine dumps, as well as the soils around and downstream from the dumps we’ve already tested. We need to determine how far the lead contamination and acidity travel down the washes and gullies and the extent to which the slope of the land affects this.
As with any field research study, it’s hard to keep all the variables constant. We’ve been careful and consistent with our tests, recording each location and using controlled testing conditions in the lab. But there are factors we can’t control. It could be that the low plant life on the dumps is simply because this is a desert, and plant life takes time to get established after soils are disturbed. The dumps were all dug up and the best materials were transferred to a leaching pile nearby in the 1980s. 30 years is not enough time for climax vegetation of sagebrush and juniper trees, but is enough time for grasses and low brush to grow. In general, soils in the area are poor in nutrients except where higher levels of water (such as in washes or gullies) allow more plants to grow and decay into better humus.
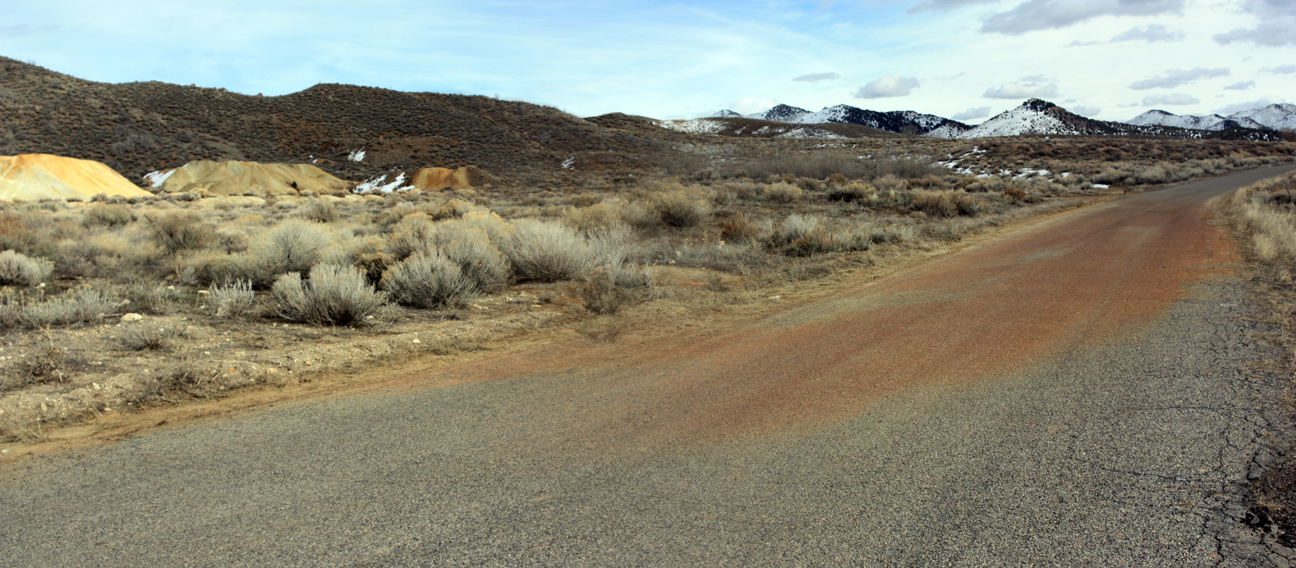
Staining on the asphalt where water draining off of the Swansea mine dump runs over the road near Silver City.