Paintings made with homemade pigments for my Intersession Science and Art class
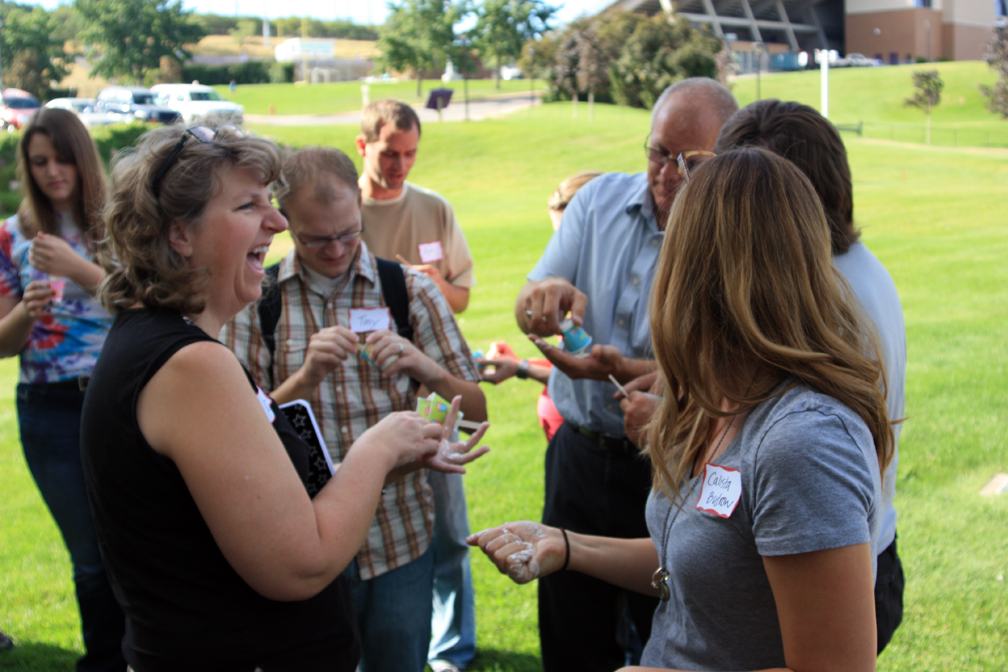
As a follow up to our lab for making iron-gall ink, I wanted to find recipes online for turning a standard high school chemical inventory into paint pigments for watercolors, pastels, or oil paints. I found some websites that use natural ingredients such as berry juice or even walnut shells, but not much on how traditional paint colors were made or how to make them today so they are colorfast and lightfast.
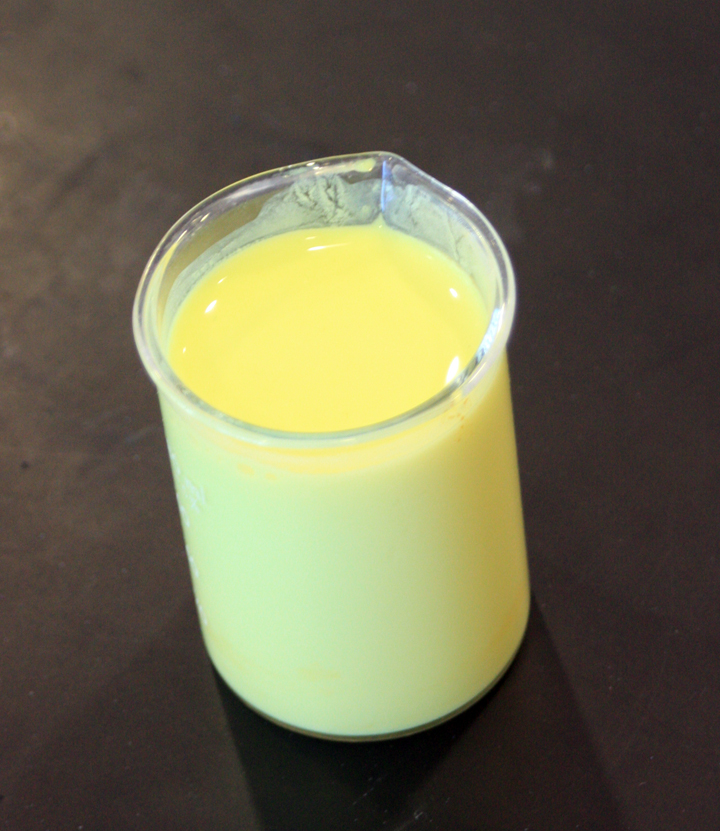
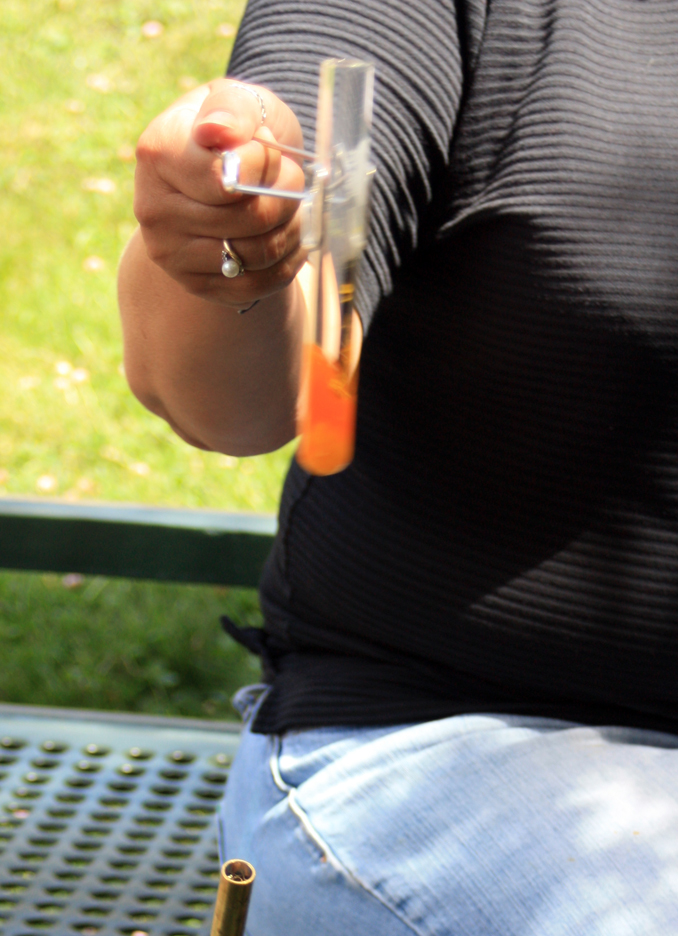
Lemon yellow pigment made from a double replacement reaction of barium nitrate and potassium chromate.
To make an ideal pigment, it must have several properties. It must be suspendable in some sort of medium, such as water or linseed oil. This means it forms fairly large particles that are opaque to light yet small enough to not settle out of solution immediately. Once on paper or canvas they should resist re-dissolving (waterproof) in the case of watercolors but be re-workable in oil paints. Pigments must stay the same color under a wide range of circumstances, including minor changes in pH or humidity or under exposure to light.
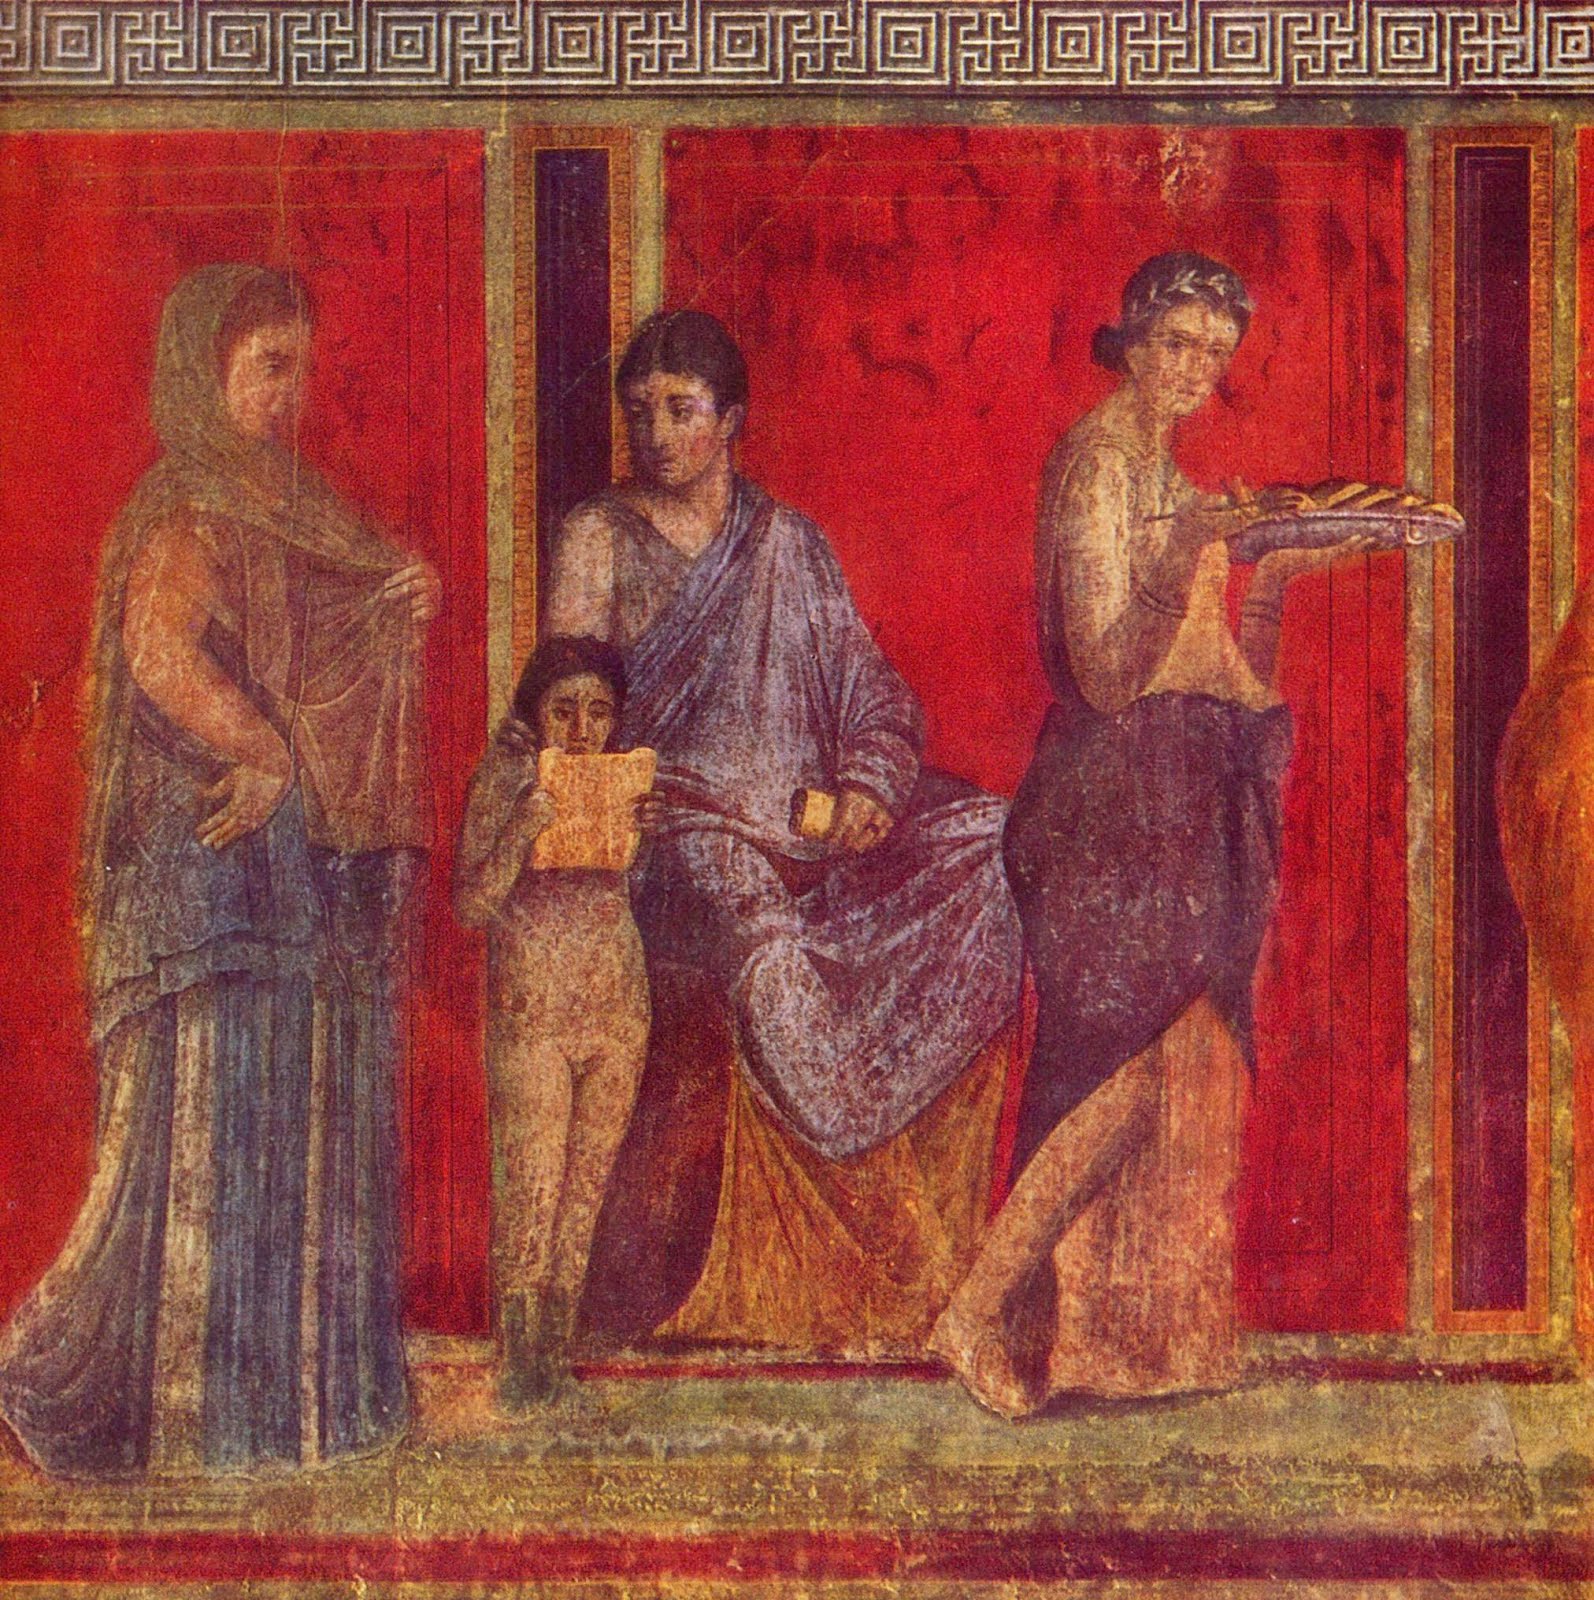
The Villa of Mysteries in Pompeii. The red background color is vermilion, or mercury sulfide made from cinnabar. According to Pliny the Elder, the painters made a nice side profit by frequently washing their brushes and taking home the wash water.
Many paint pigments were originally made from colorful rocks or minerals, such as lapis lazuli, aquamarine, charcoal, orpiment, or cinnabar. Some of these minerals, such as cinnabar (mercury (II) sulfide) are toxic. Most of the red pigments tend to be this way, or else aren’t a very bright shade of red. Yes, iron oxide (rust) makes a reddish brown and madder root makes a dull burgundy, but only cinnabar (also known as vermilion or Chinese red, which is a bright orange red) or lead oxides (known as minium) could produce a good red until the Spanish Conquest of the Americas.
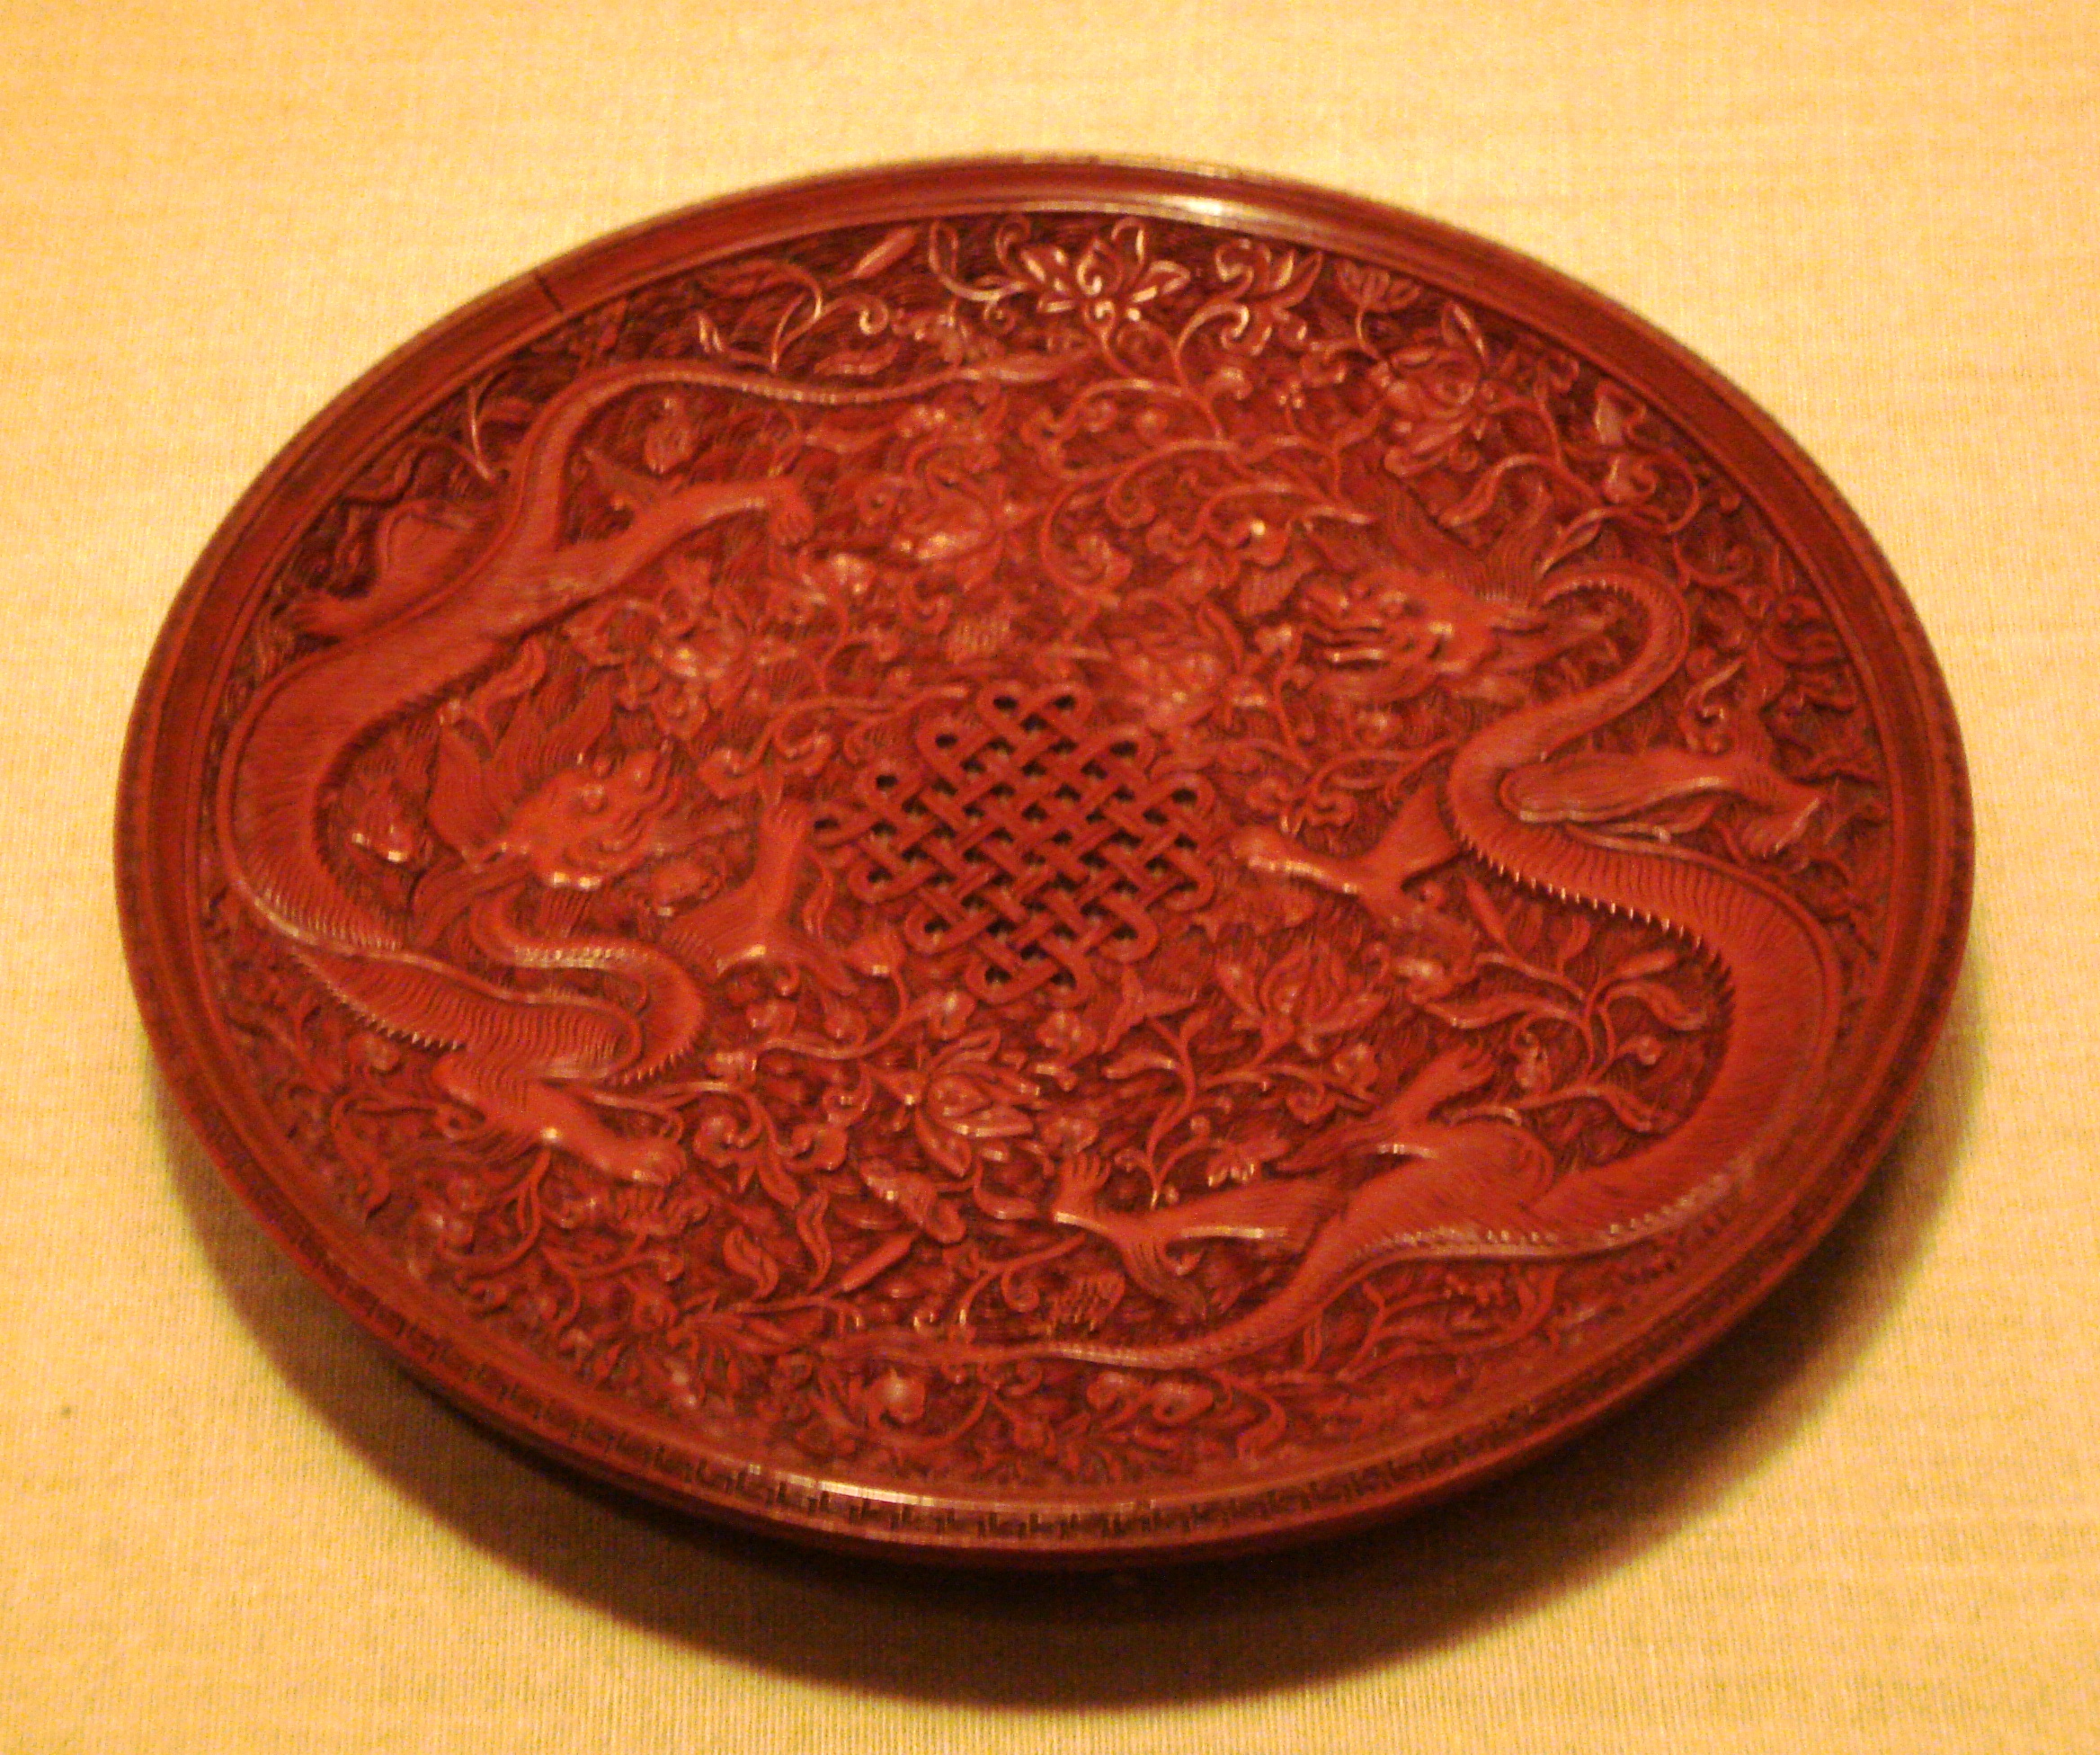
Chinese red lacquerware box colored with Chinese red, or cinnabar.
When Cortez conquered Mexico, he found an abundance of cloth dyed a bright red color and on investigation found that the dye was produced from a ground up insect called cochineal. It produced a range of bright reds from magenta through red-orange, depending on how it was treated. He brought samples of the cloth and the bug (along with samples of chocolate, but that’s another story) back to Spain with him. The insect grows on a particular species of prickly pear cactus in Central and South America, and the Spanish eventually found it could grow and prosper in some parts of southern Spain and on the Canary Islands. The dye it produces is called carmine. It is the red of a cardinal’s robes and the red of the British Redcoats. It is still used today, including in various types of red or pink-dyed foods, including strawberry milkshakes. In the food industry, it is known as Red Dye # 4.
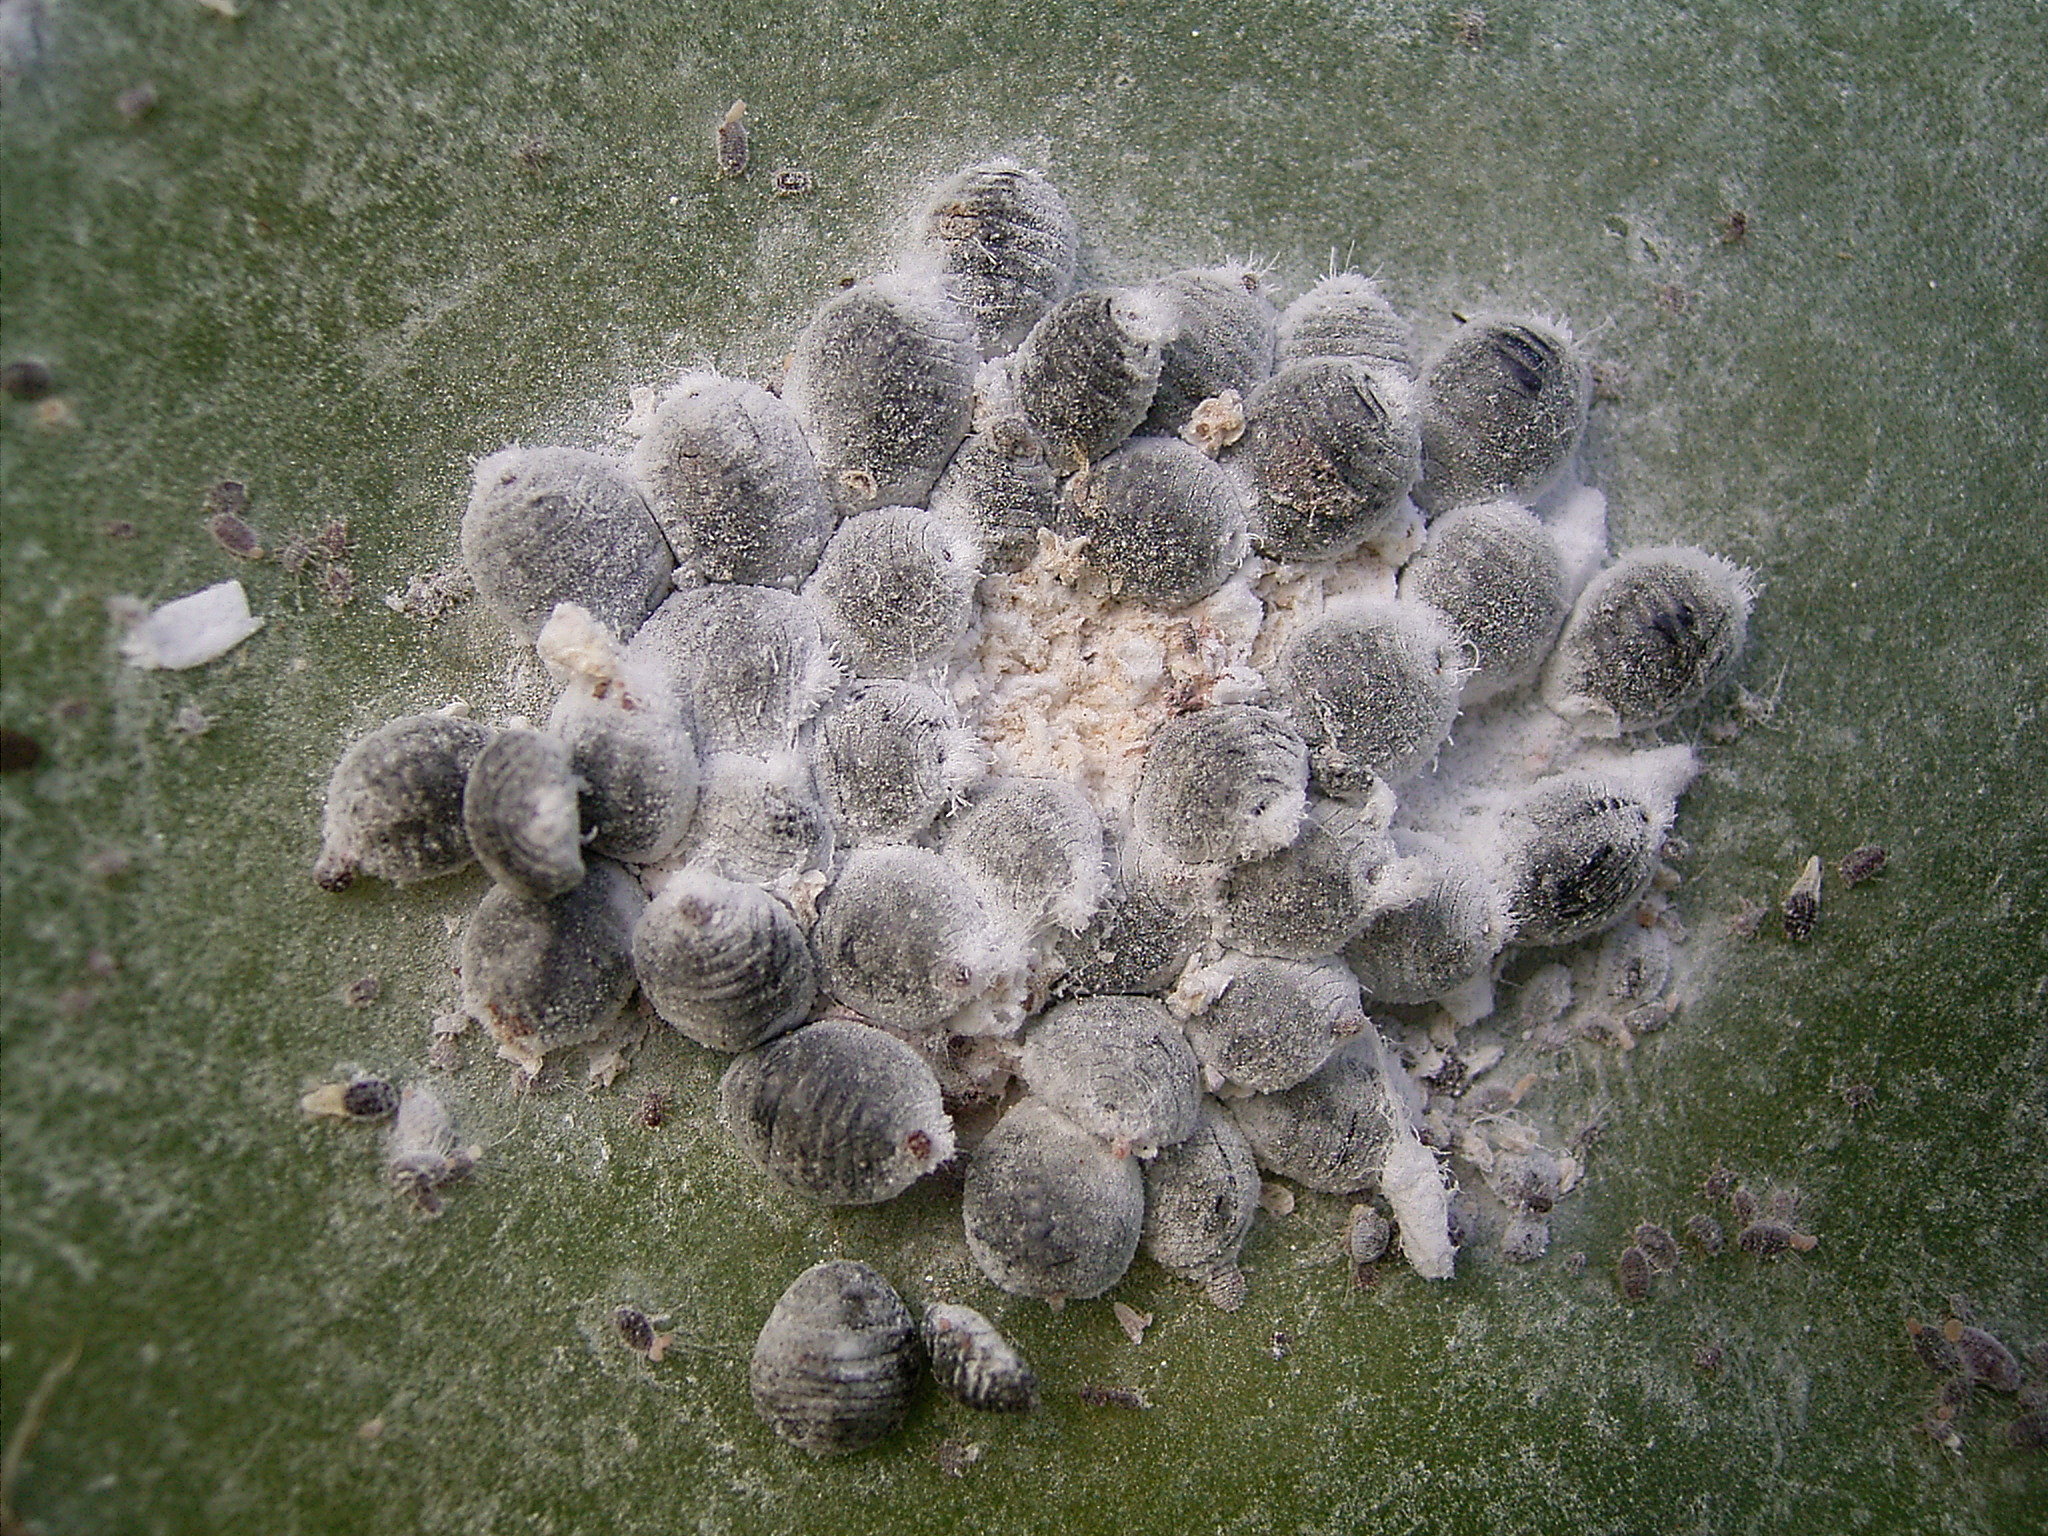
Cochineal insects living on large cacti. The female insects are sessile, attaching themselves permanently to the cactus and extruding a waxy coating to prevent dehydration. The carminic acid helps to ward off predators.
The types of reds used for painting now are cadmium red (which is rather expensive to make) and alizarin crimson, a synthetic pigment made from coal tar derivatives. You can also get a pink color by using a hydrated form of cobalt chloride as a pigment, but it turns bright blue as it dries out.
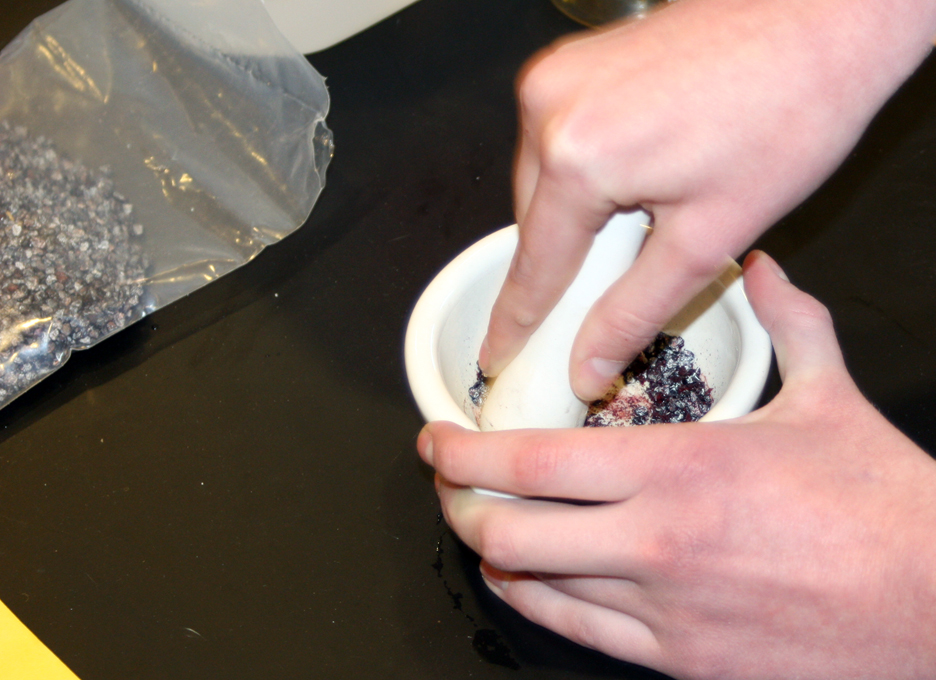
Grinding dried cochineal insects to make carmine pigment. This dye is also used in foods. Yes, you are eating bug juice.
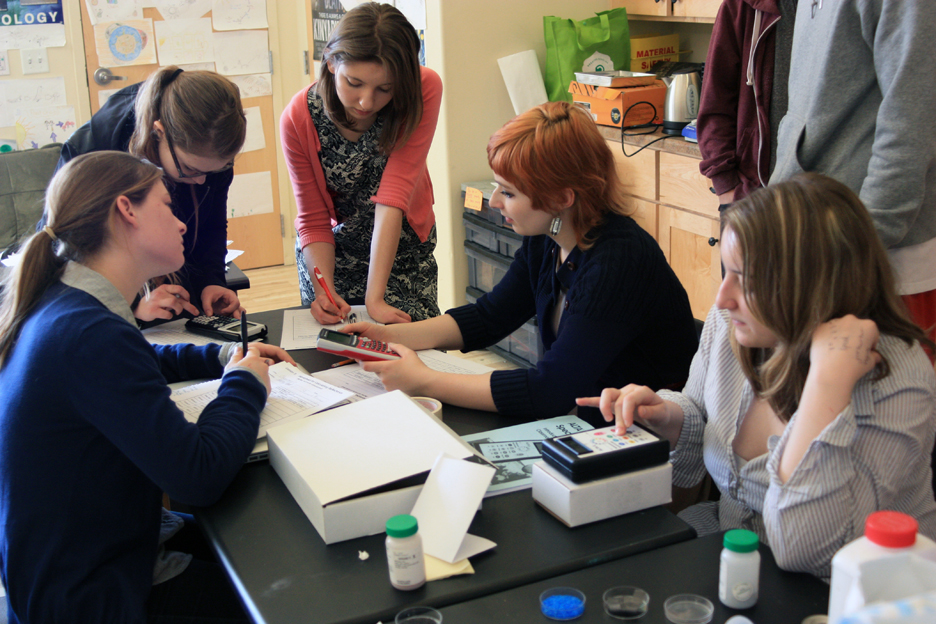
After searching all this out, I finally came across a website that provided information on the history and production of various pigments. It is called Pigments Through the Ages and has a URL of: http://www.webexhibits.org/pigments/. It shows all the various colors made, gives the history and traditional methods for producing them, as well as modern equivalents. I determined to try these out in my chemistry and Intersession classes. We did some experimentation and here are the recipes we developed:
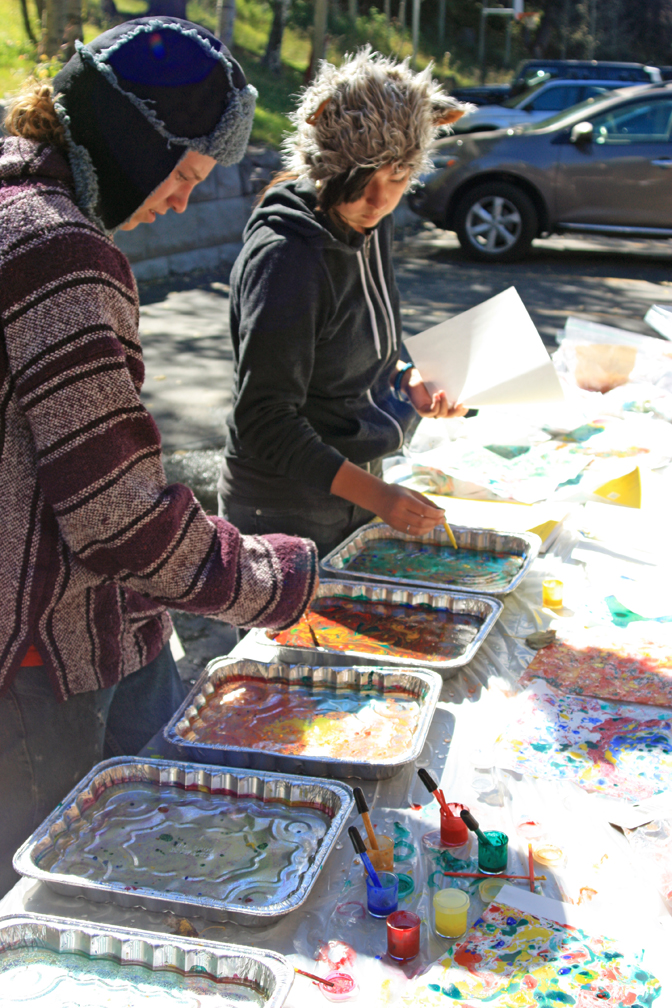
Once we got a viable pigment, we added a few drops of gum Arabic as a binder and to thicken the pigment. Then we tried it out by sketching and painting illustrations. My chemistry class had to paint something related to the history of chemistry or their own chemistry presentation topic.
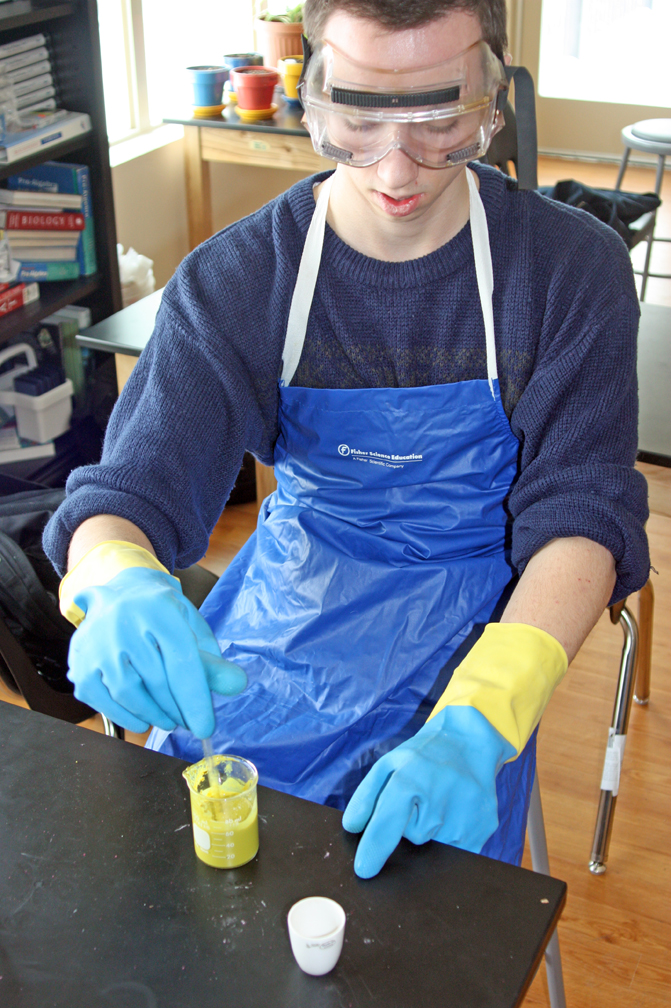
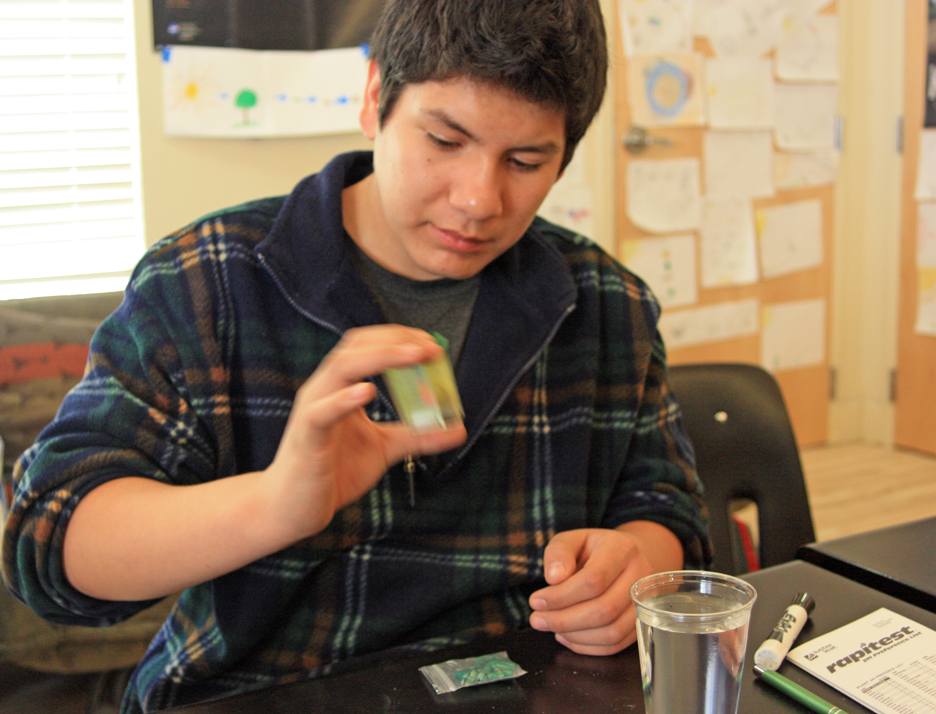
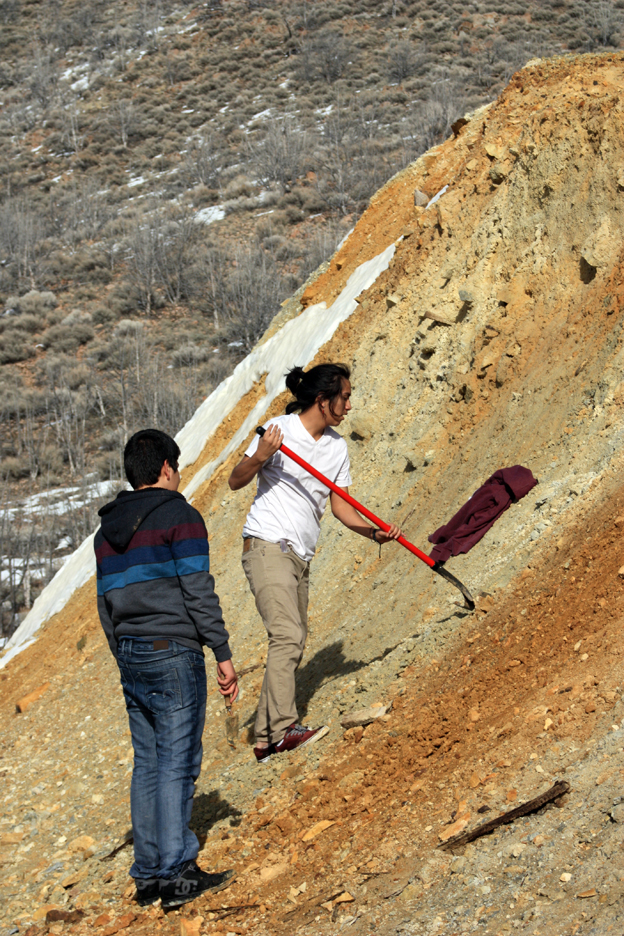
Chemistry student Evan makes synthetic yellow ochre pigment.
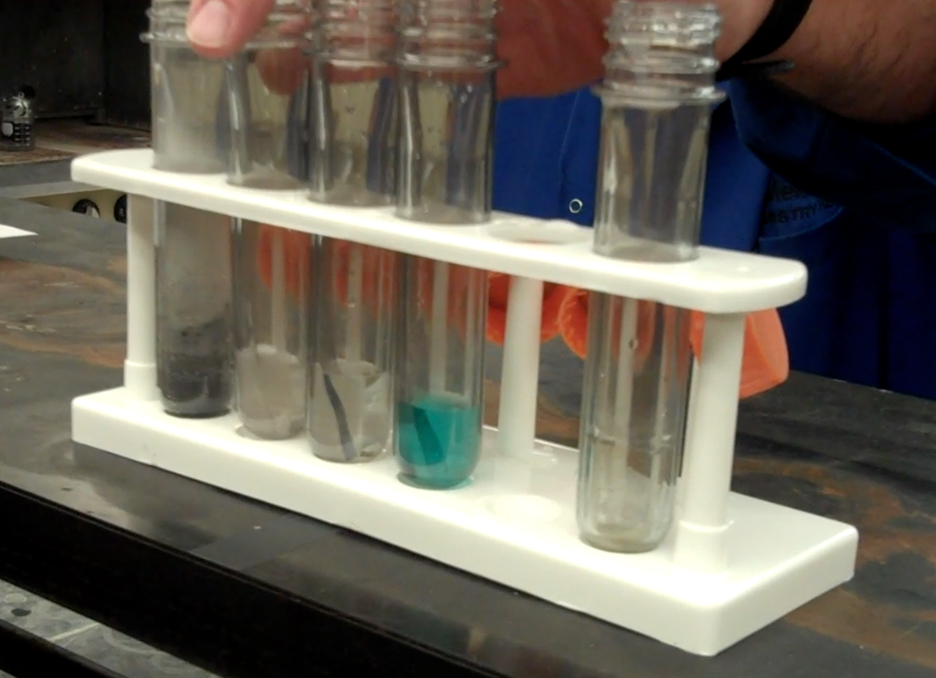
Please feel free to experiment, adapt, and test these formulas. From our experiments we had some interesting results. The Cobalt blue recipe was a light purple/pink in solution (the hydrated cobalt chlorides) but dried a bright cyan blue color. This happened every time we made it in class, yet one student who wanted to test these pigments as a science fair project made her own cobalt blue which turned out staying a medium blue as the recipe said it should. I’m not sure what she did differently. When we made the cobalt purple, the student wanted to thicken the resulting solution by boiling off some of the water. This produced a bright pink pigment that was colorfast and was very useful combined with lemon yellow to make a flesh tone.
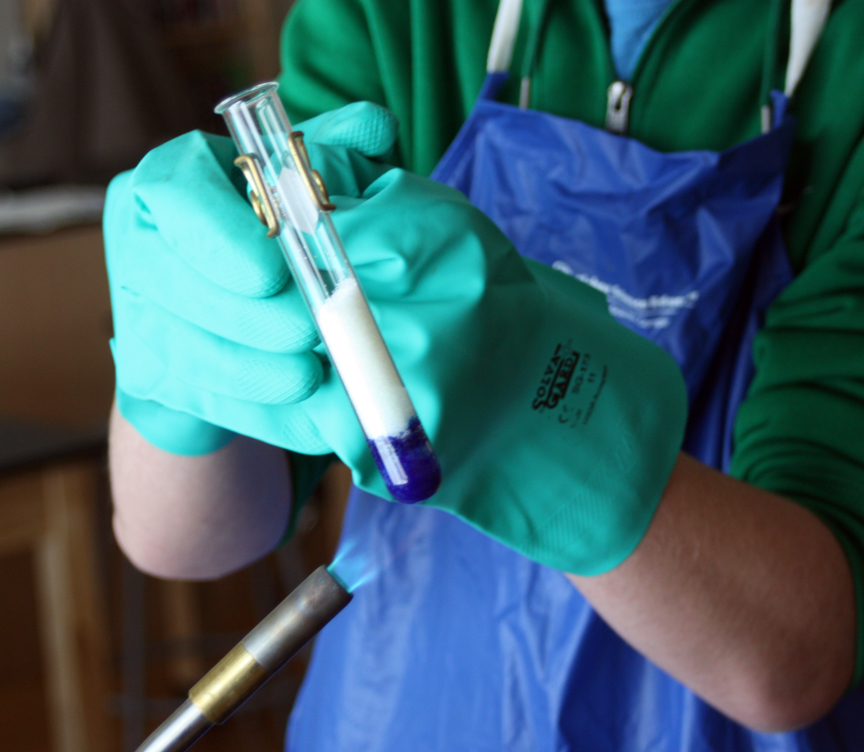
Making cobalt blue pigment.
The lemon yellow and Prussian blue formulas are infallible. The yellow ochre recipe was interesting. It starts with the same cobalt chloride as two other pigments, but uses glacial acetic acid to convert it to yellow. It works to make a powder and then hydrate it once the process is done, producing a pigment that is a dull yellowish gray dry but makes an intense slightly grayish yellow when dissolved in water. The carbon black (India black) was easily made from finely ground charcoal, although I would use a charcoal without self-lighting fluid. It makes an oil slick on the pigment. You could probably use soot even more advantageously as it is already finely divided. Just build a small campfire and put a piece of metal over the flames to collect soot, then scrape it off for a pigment.
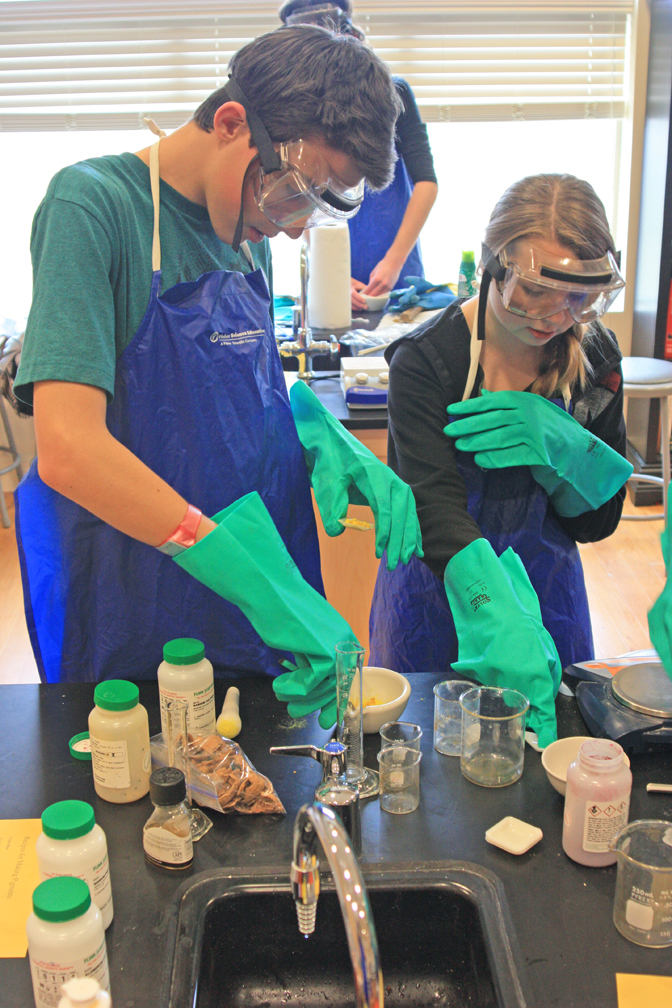
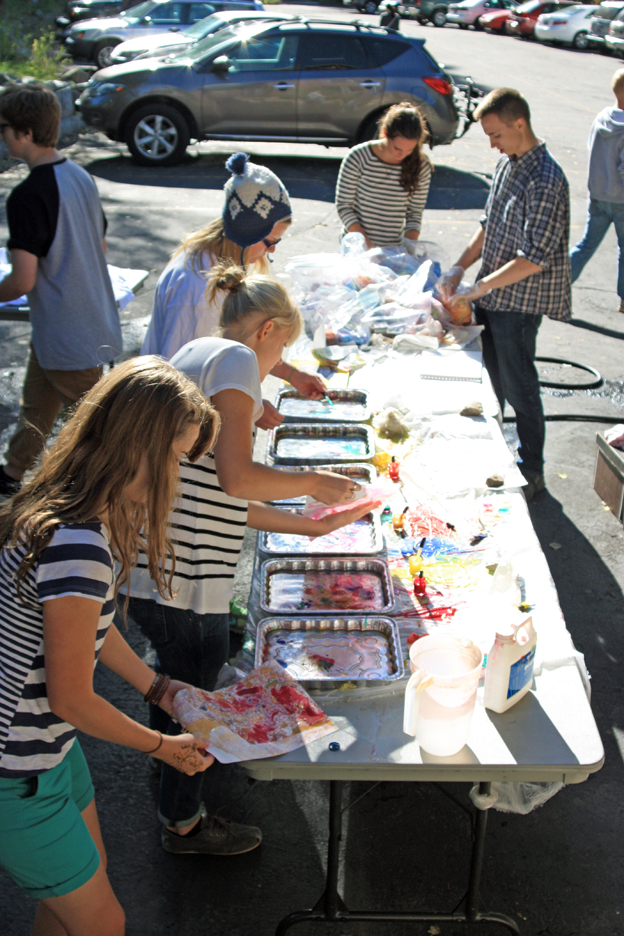
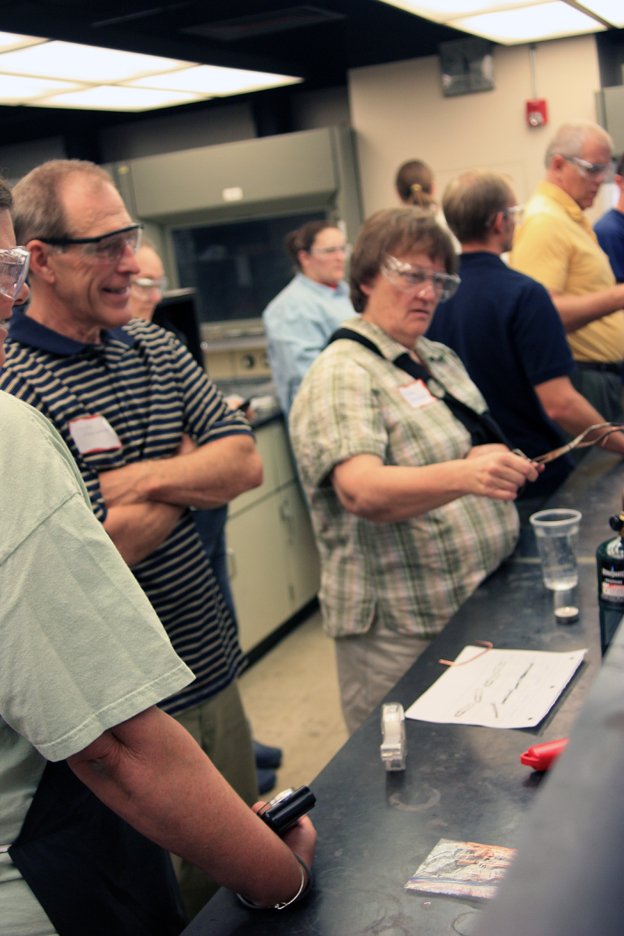
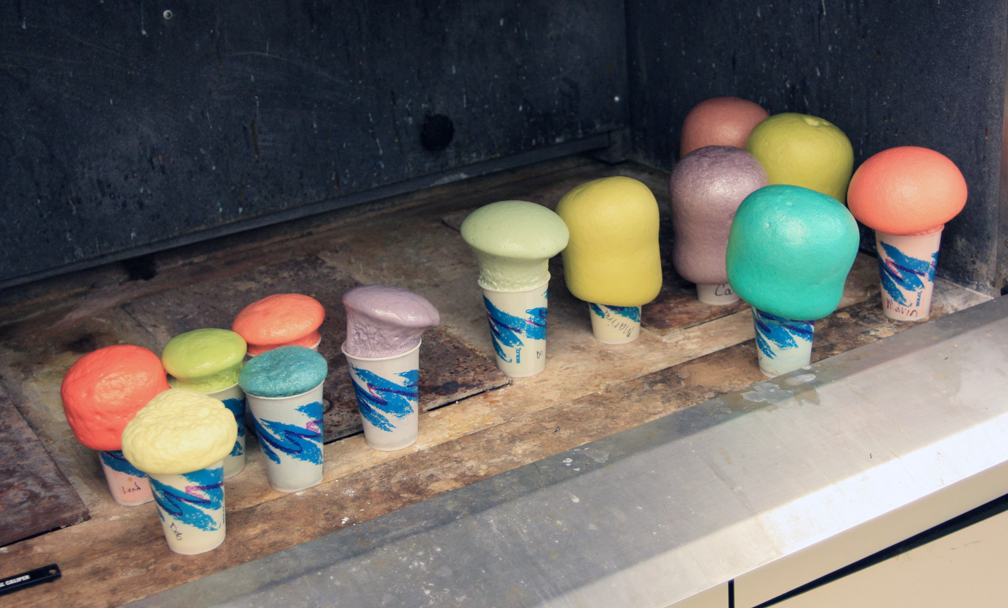
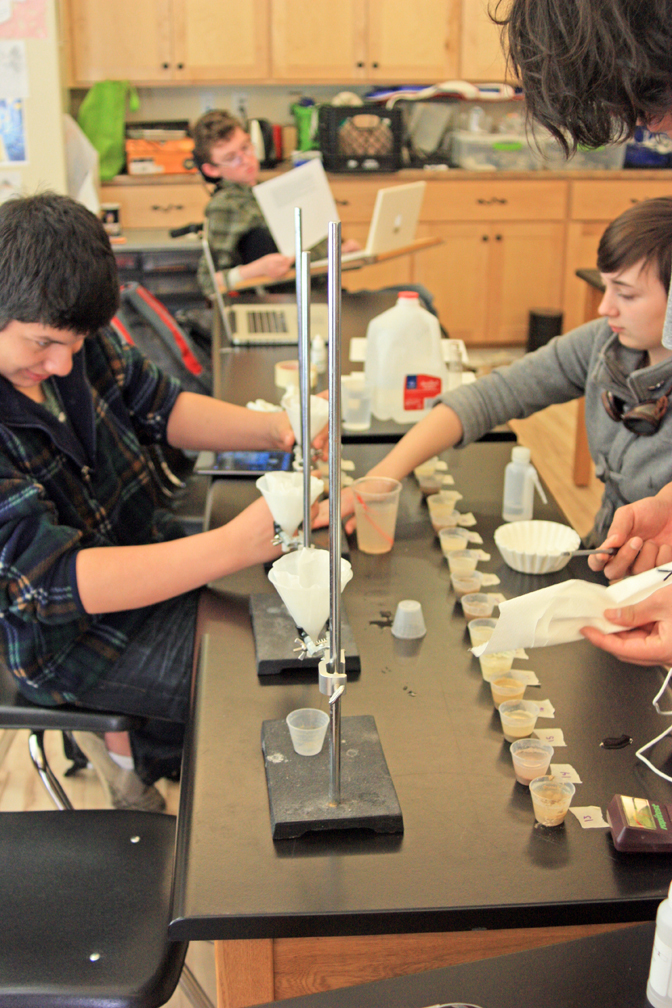
Making pigments in the lab at Walden School
The colors we had trouble with were browns and reds. I have not tried making a pigment from walnut shells, although I have collected some for the purpose. I did try to make brown using a piece of yellow ochre mineral (iron sulfide and oxide) I had, but the powdered ochre would not mix with water and rubbed off the paper even when I tried using some gum Arabic to bind it.
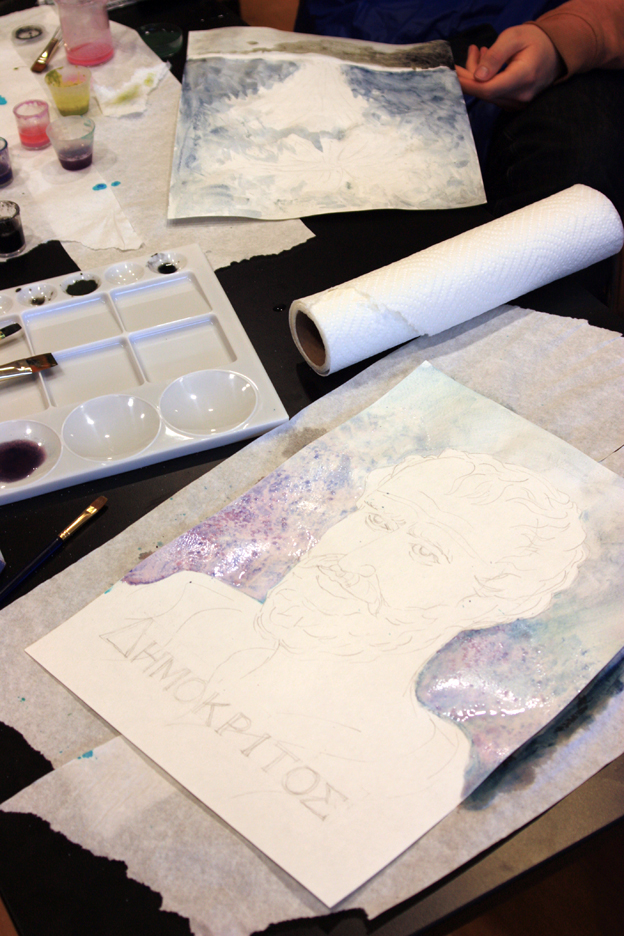
Beginning to paint the background washes using cobalt blue (which looks pink when wet) and prussian blue.
As explained above, red is a problem. I didn’t want to make red using lead or mercury compounds (minium or vermilion) and I couldn’t afford the cadmium, so the last result was to use cochineal, which I ordered from the Dharma Trading Company. Our first attempt was only partially successful. We ground up the insect bodies in a mortar and pestle and a red fluid came out, mostly carminic acid. We tried using it directly as a pigment, but the paint turned black with exposure to air. We then tried adding natural chalk (calcium carbonate) to make a lake, and that started as an opaque burgundy but turned black within a few minutes. Finally, I tried using alum powder (aluminum hydrogen phosphate) as a mordant and it made a nice burgundy color that was permanent.
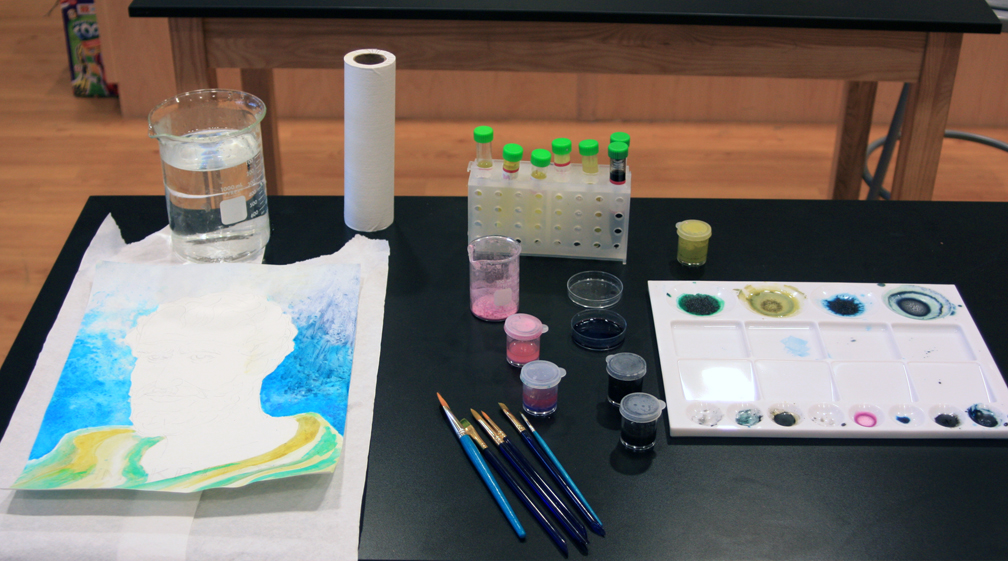
Adding green robes made from a mixture of lemon yellow with cobalt blue and yellow ochre with Prussian blue.
Further research into cochineal told me that the best way to use cochineal to make carmine pigment is to crush the dried bus in a mortar and pestle, then filter the solid parts out by running the bug juice through filter paper or cheesecloth. Then add alum powder to stabilize the deep burgundy color. By adding a little vinegar, the color can turn a bright transparent red to reddish orange that will stain and dye cloth and work well for a watercolor pigment. I will try adding some chalk to it at this point to make the pigment opaque for pastels or paint.
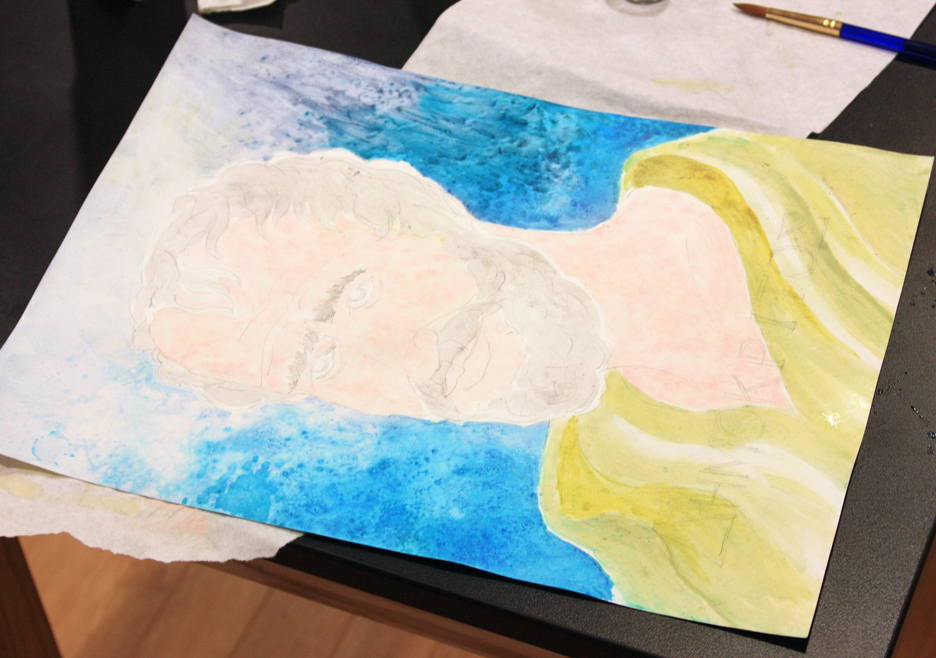
Flesh tones (lemon yellow with cobalt pink) and gray beard (carbon black).
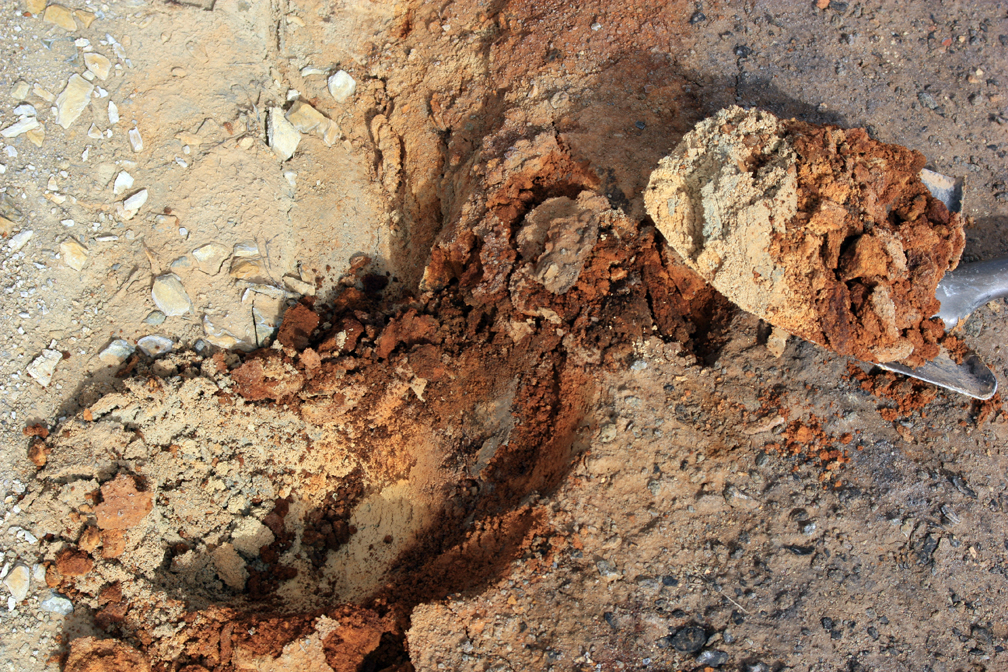
As for the brown colors, even to this day most browns come from a clay which is dug out of deposits near the towns of Sienna and Umbria in Italy, then ground fine and used as a pigment. Sometimes they are heated or “burnt” to darken the color. This produces the colors raw and burnt sienna and burnt umber. I can’t exactly take a trip to Italy just to dig up dirt, so I’m working on my own browns out of walnut shells and other organic and mineral sources. I’m a bit stumped on how to grind up the walnut shells to get a fine powder.
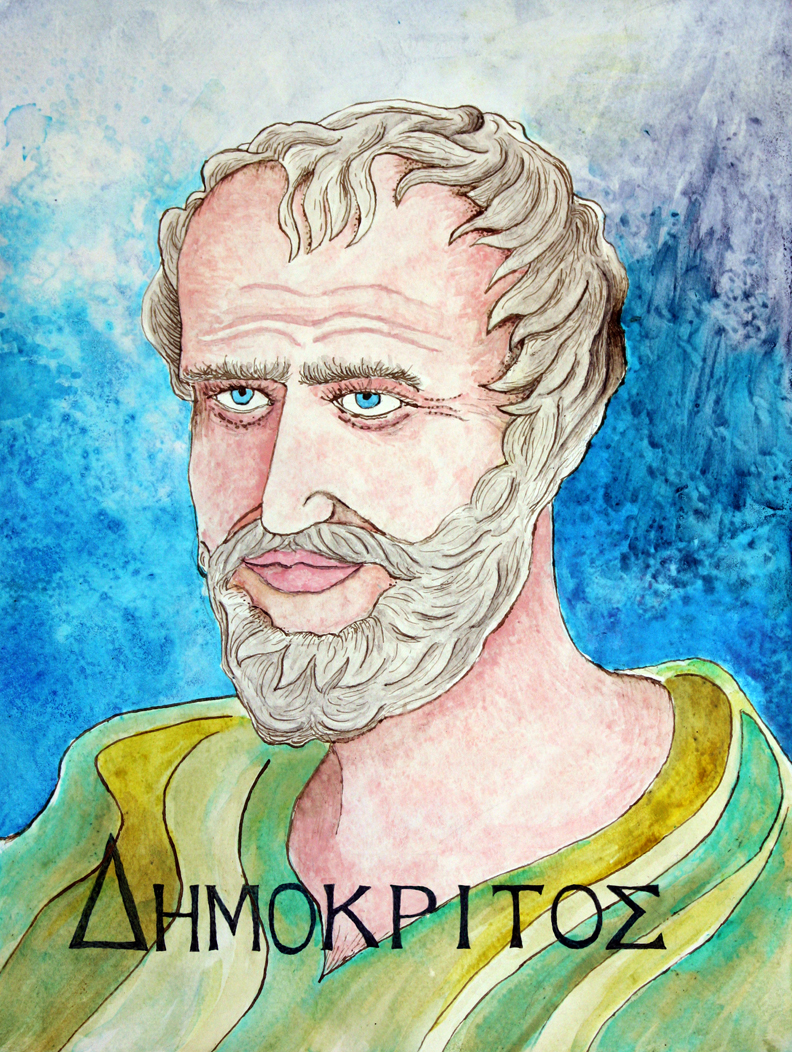
The finished Democritus with pen and ink details. It was painted entirely with homemade pigments and inks.
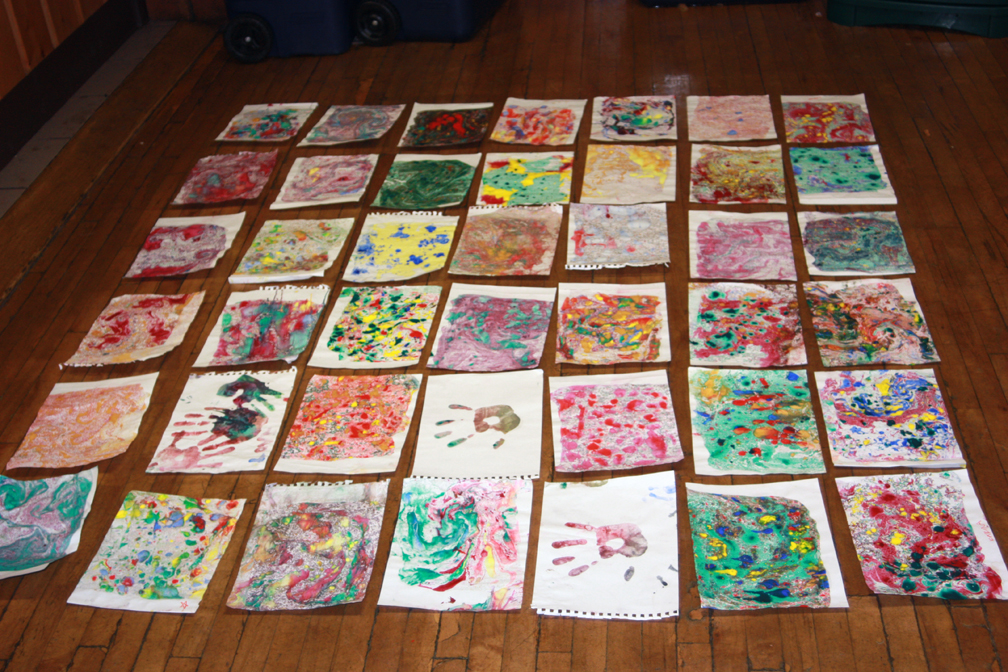
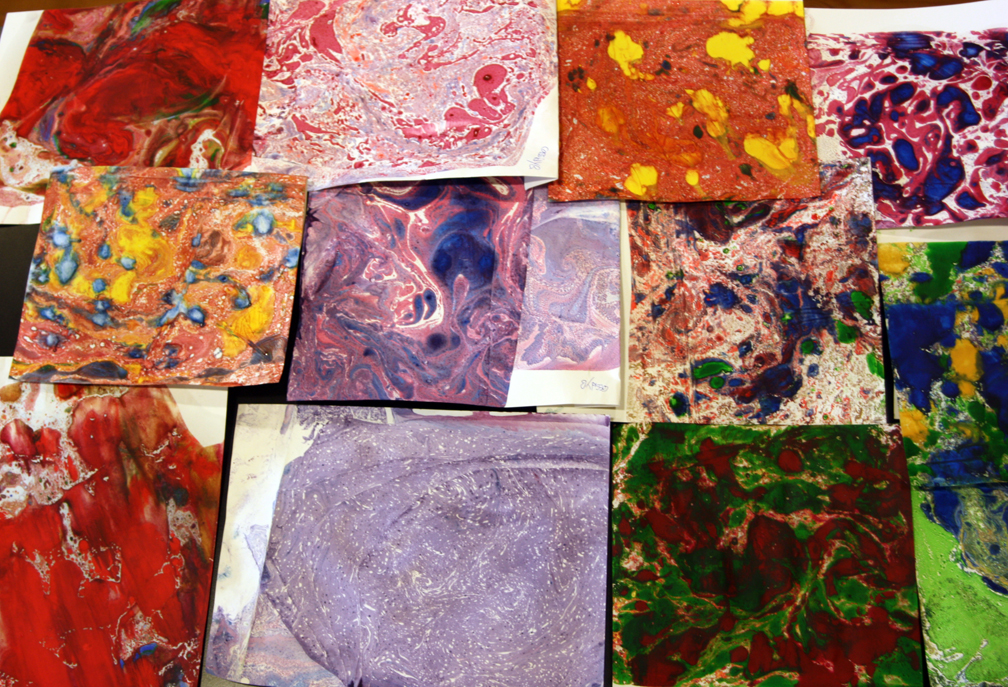
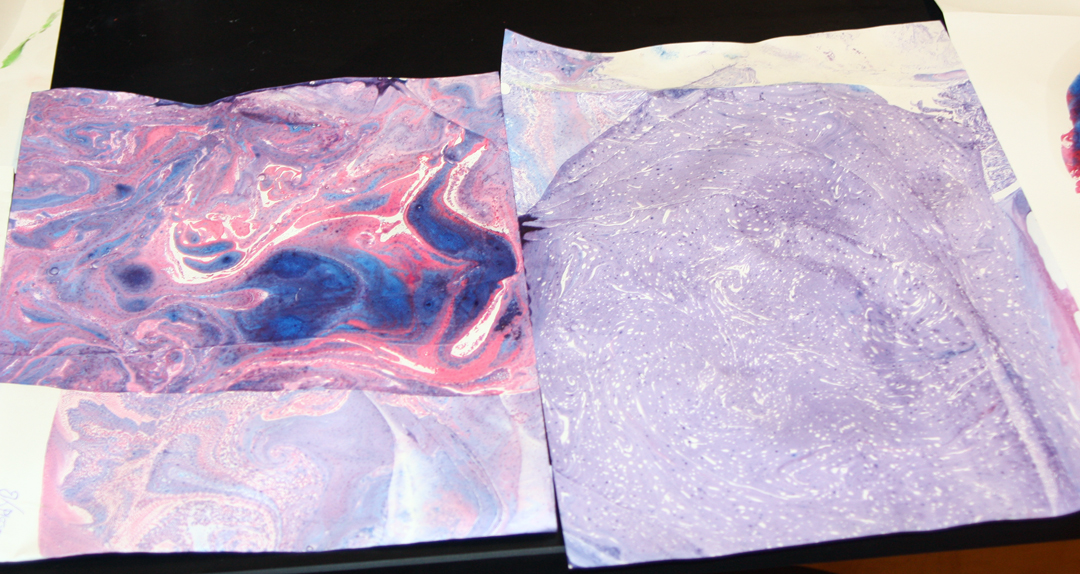
I’ve included some of the paintings we’ve done. I did the one on Democritus, but others were done by students. I added details at the end with iron-gall ink and Prussian blue ink and a Speedball drawing pen. I also have a piece of watercolor paper that I’ve been using to paint and test swatches of our homemade paints, and you can see we’ve had some interesting results. We can now create about any hue, shade, or tint we need.
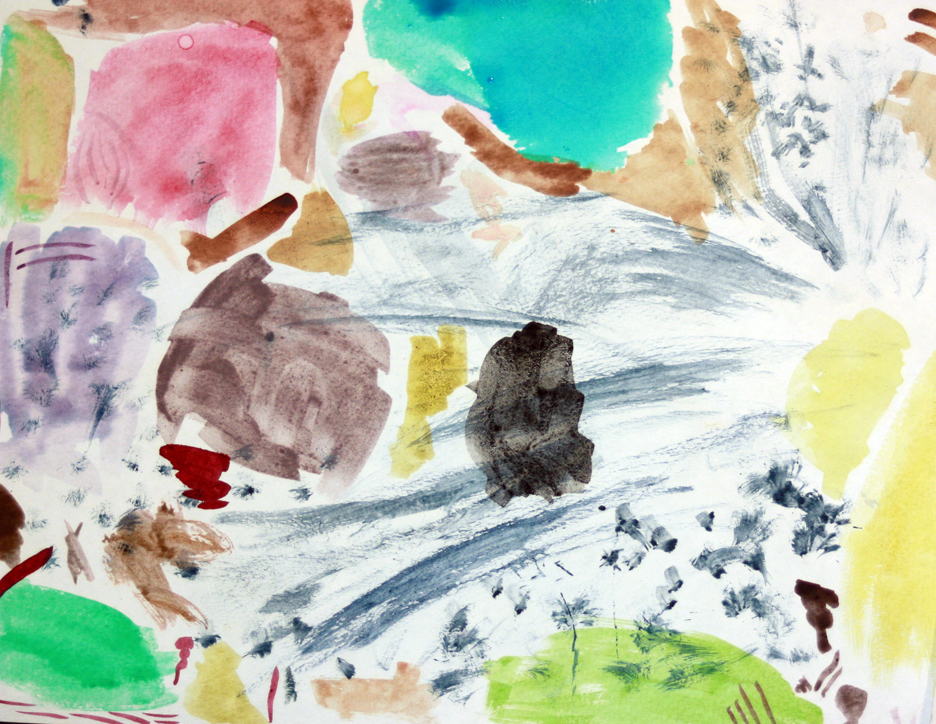
Paper of color swatches, used to try out variations and mixtures of pigments. The stabilized carmine is the deep burgundy swatches. The bright cyan is cobalt blue.
This has been a fun and informative exercise in inquiry and experimentation. We’ve seen most of the types of chemical reactions, have seen a variety of physical and chemical changes, and have even practiced some stoichiometry as we work on the finding the best ratios of reactants for our pigments.
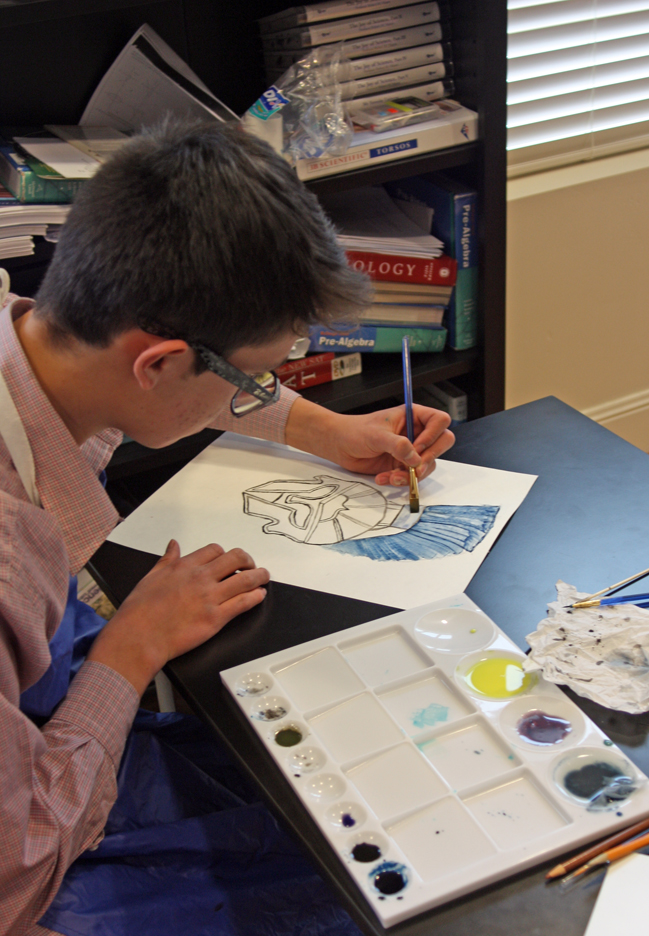
Sebastian painting Greek armor using Prussian blue and cobalt blue with carbon black pigment he made.
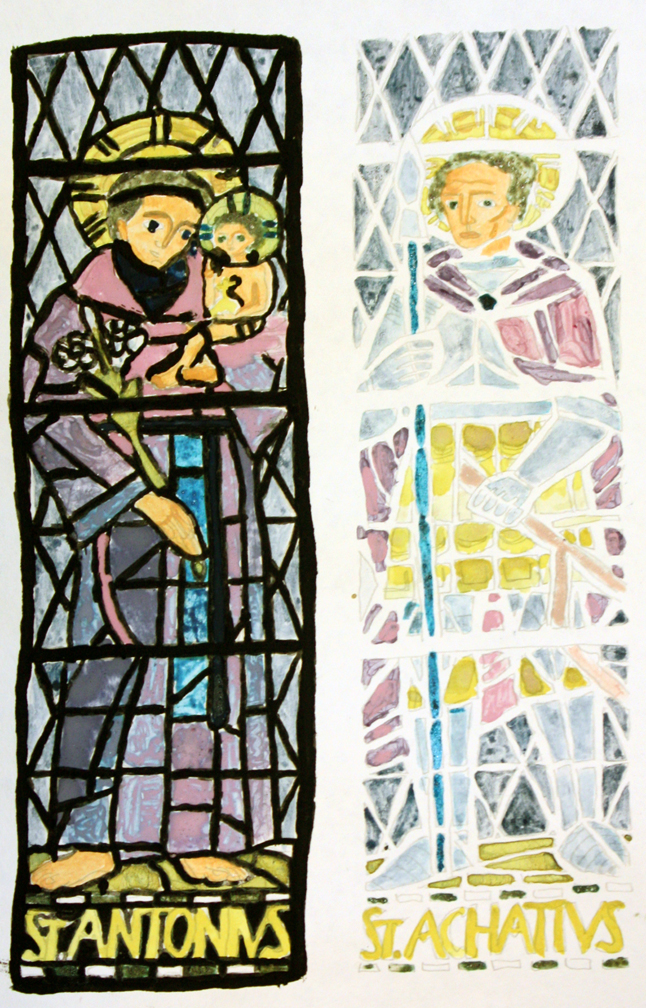
Painting of stained glass windows by Nicole.
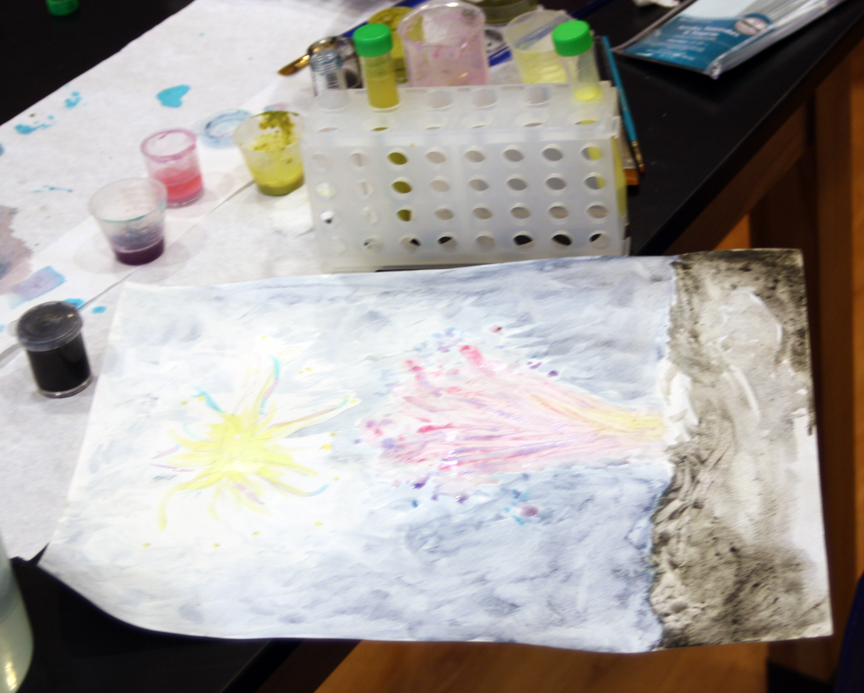
A painting of fireworks in progress.