
Some of the soil samples from the Tintic Mining District
Although it’s been over six months since we conducted these experiments, I want to report on what we did before moving on to other topics so that these blog posts will be in the right order. So much has happened doing chemistry that I’ve fallen behind on reporting and writing about chemistry and the elements.
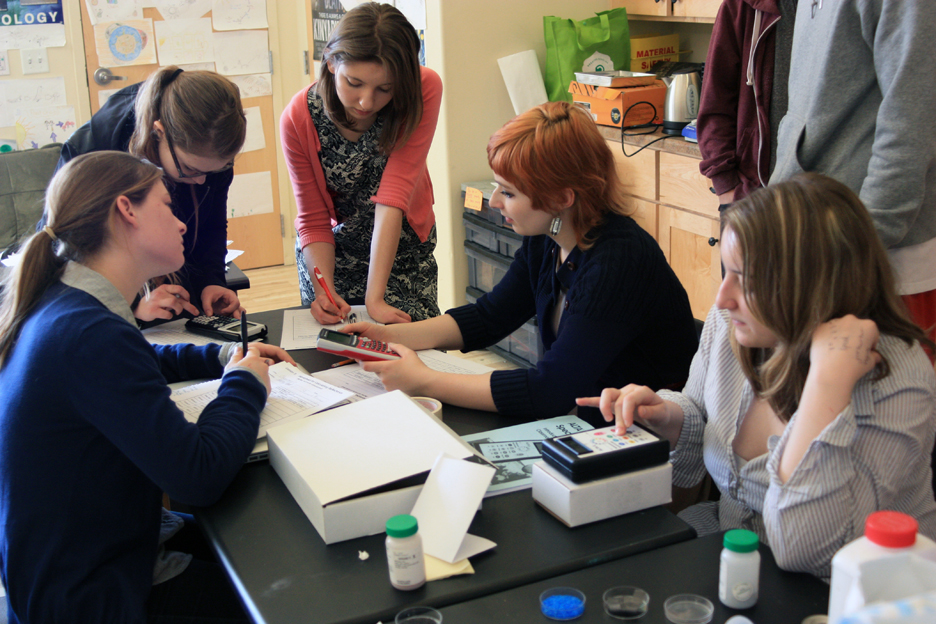
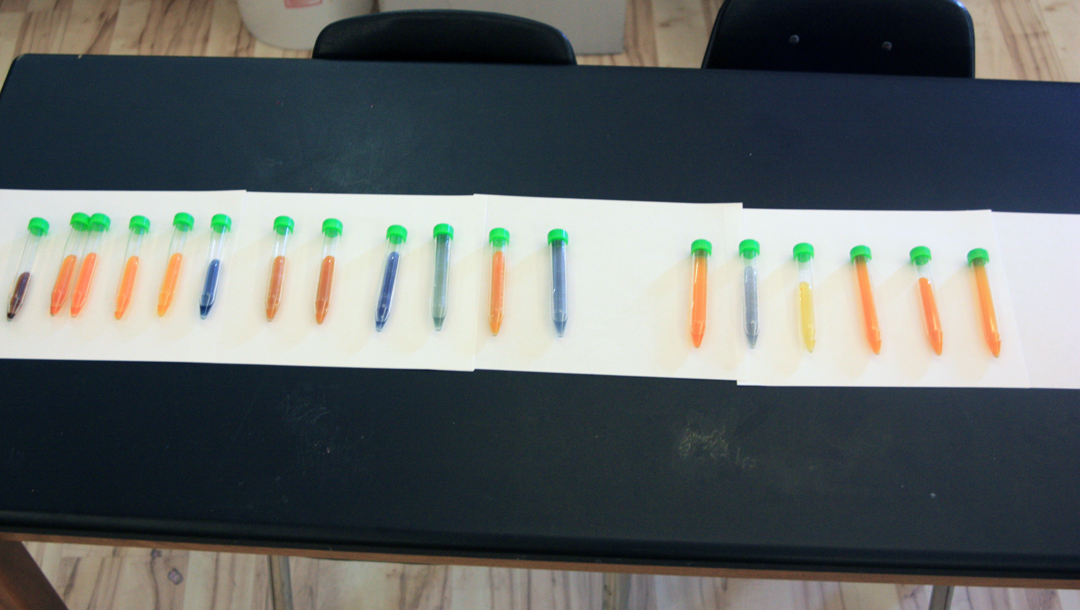
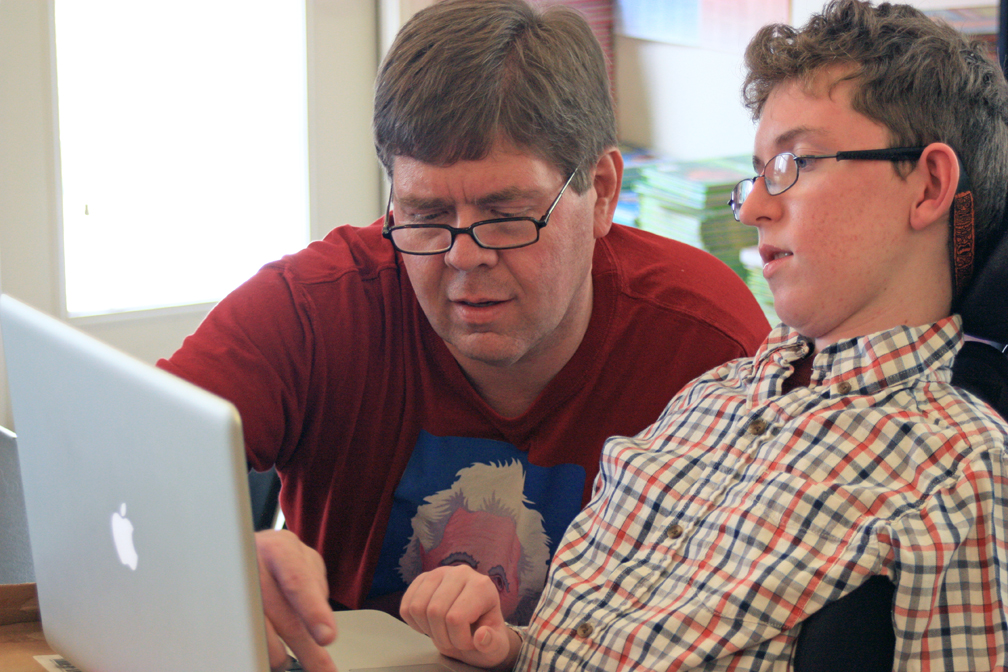
Chemistry students test chemicals with the ALTA II reflectance spectrometer
During our Intersession class in March, we visited the Tintic Mining District three times in addition to our visit the previous fall. This made four collection trips altogether, and we got 42 samples from over 20 locations. Some of these were from areas inside the town of Eureka, some were outside in areas with heavy mining, such as on or around mine dumps, and some were control samples where no mining has occurred. Our goal was to test these samples for lead and other metal contaminants as well as pH.
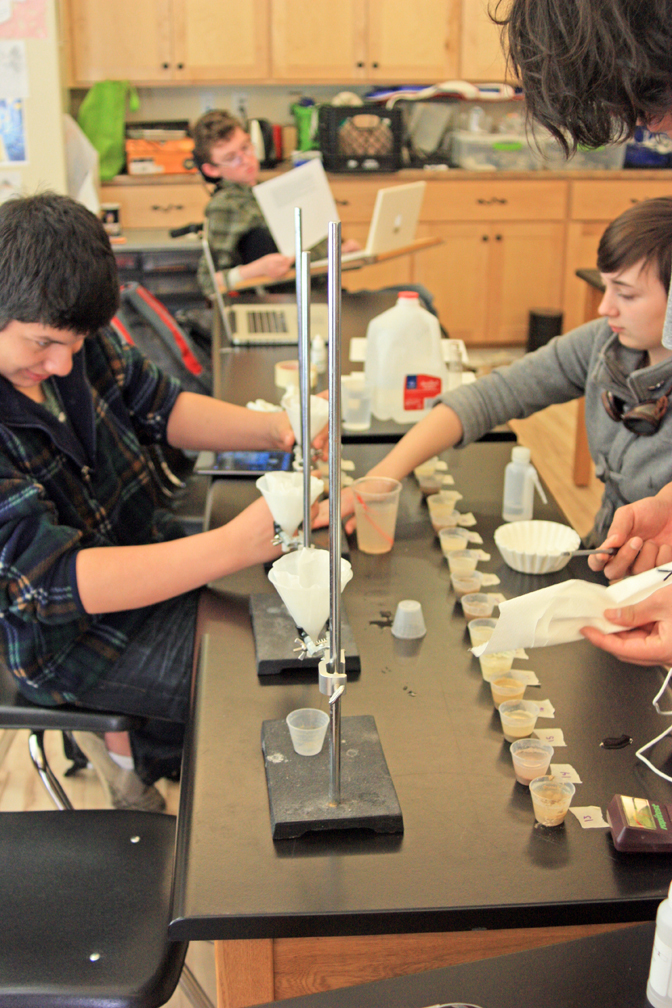
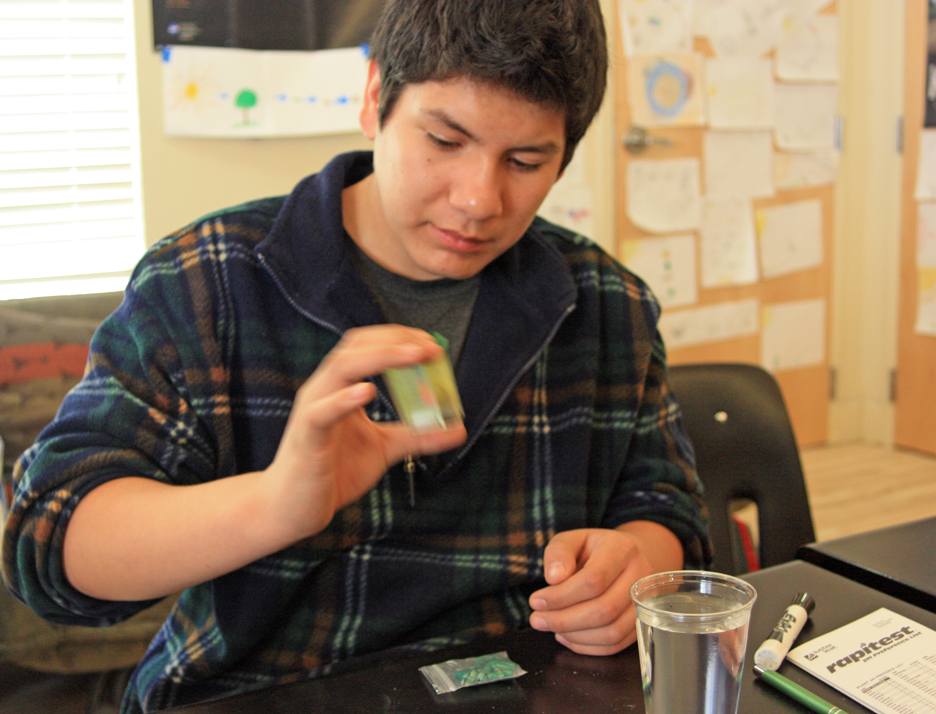
Sean, Jem, Indi, and Jeffrey add water to soil samples
We did this in several ways. First, we took a field pH meter with us to test the soils as we collected the samples. Since most were gathered in March, the ground was damp and the pH meter worked well. The areas around mine dumps showed extremely low pHs (the meter pegged at about 2.5, so the samples were lower still). They also showed the most discoloration, ranging from yellow to purplish colors. These sites also had little or no vegetation.
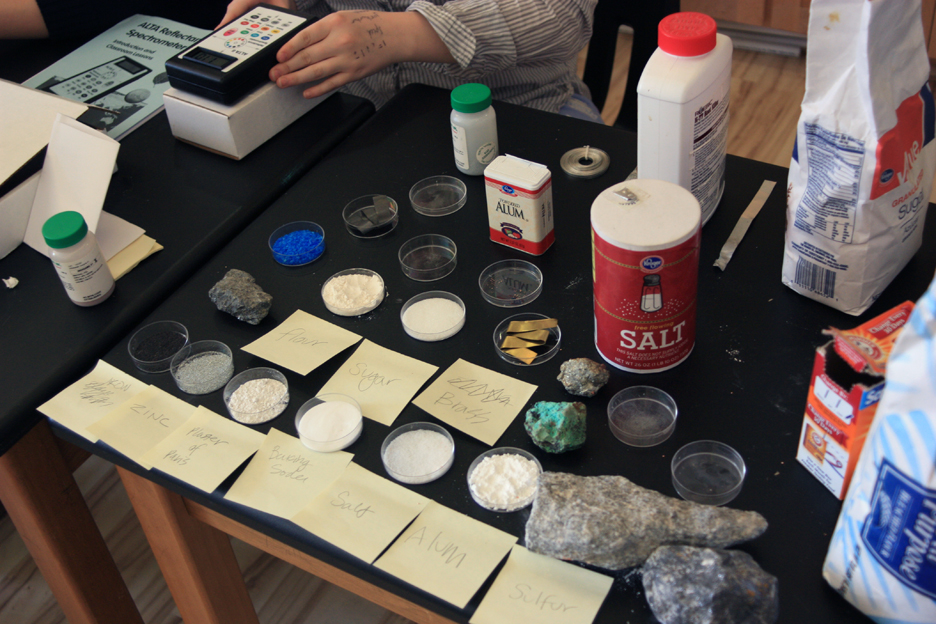
Chemicals and minerals tested by the chemistry students using an ALTA II reflectance spectrometer
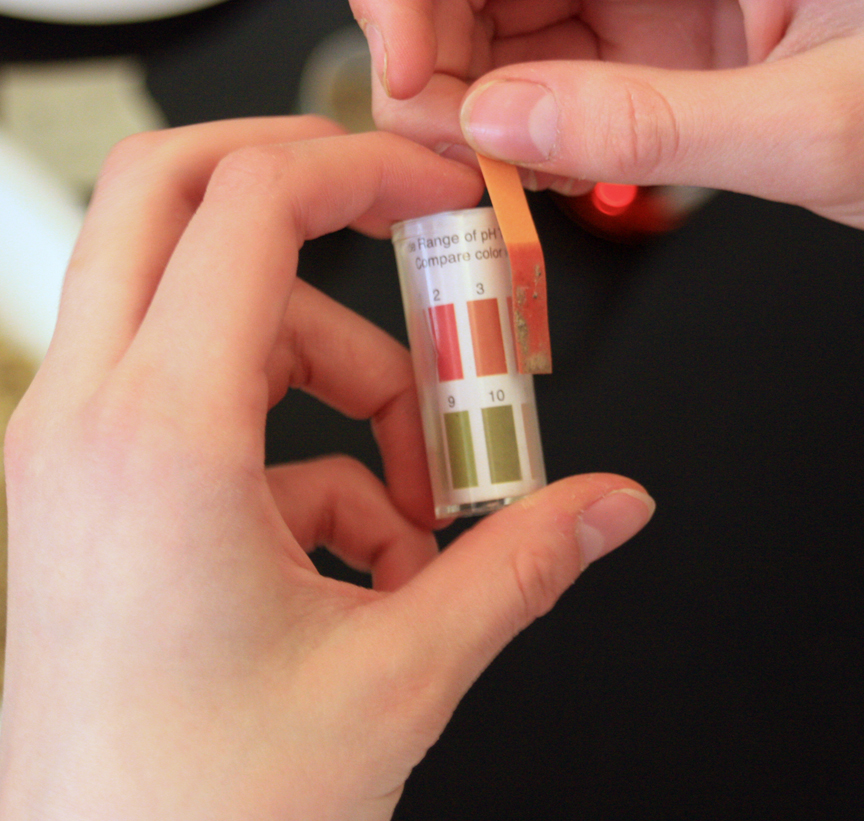
Measuring pH using universal test strips
Even though the field pH meter worked well, we weren’t sure if it was consistent or reliable given that the soil samples had different amounts of moisture. When we took the samples back to our chemistry lab, we took them out of the Ziploc bags they were in and placed them onto paper plates to dry for several days. Students measured 10.0 g of each and added 25 mL of distilled water, stirring the samples to mix the soil with the water as much as possible. Then we tested each with the pH meter, universal pH test strips, and more specific test strips. We also used a garden soil nutrient test kit that included a pH test where a pill was emptied into the wet sample and color read off of a chart. The various results were set up on the whiteboard as a table, then my student Jem set up a spreadsheet to record and chart all the samples to compare which pH test method was most sensitive and accurate.

Testing for lead with sodium rhodinzonate. The blue color of the second to last sample indicates both lead and acid.
Another test was to see how much lead was in the samples. Our technique was to use a kit for testing lead in soils using a solution of sodium rhodizonate, which turns from reddish orange to pink in a control solution of lead nitrate. Our samples brought back from our first and second collect trips were tested by filtering out the sediment from the soil mixed with water, then taking the filtrate and adding the rhodizonate solution. Most of the solutions stayed orange, but one turned purplish blue, not pink. It was the sample taken from the Tesora mine dump. This was puzzling until one of my students, Sean, looked up the rhodizonate test and found that it does turn purple-blue if the sample is acidic. When testing its pH, we found it was highly acidic with a pH of 3.0.
Results of rhodizonate test, with colors ranging from orange (no lead) through yellow (moderate lead) to green and blue (high lead). The test was qualitative, not quantitative.
We began to see there was a correlation between low pH and lead content. As we repeated the test with other samples, we refined our techniques and came up with a color gauge that provided a rough quantitative scale for the amount of lead present. Most samples, including all from inside town, had a pH of 6.5-7.0 and the rhodizonate stayed orange. Where the pH was a little lower (6.0-6.5 and 5.0-6.0), such as in areas downstream for mine dumps, the rhodizonate turned orange-yellow or yellow. A pH of 4.0 – 5.0 showed a rhodizonate test of light green. A pH lower than 4 showed a test of blue. The correlations between the amount of lead and the acidity of the soil were very strong. We set up a scale of orange equals no to very little lead, yellow a small amount of lead, green a larger amount, and blue the largest amount with numbers 0 to 4. Unfortunately, the rhodizonate test is not specific enough to show actual quantities of lead, and we have no way of knowing if a number 4 (blue) test has twice as much lead as a number 2 (yellow) test. That will have to wait for x-ray fluorescence spectroscopy or some other technique.

Control tests for lead using the sodium rhodizonate solution (on the right). The second to the right shows pink color when the test solution is added to a neutral solution of lead nitrate. It turns purple (second from left) in an acidic solution that contains lead. It produces a white precipitate in a basic solution of lead. In the soil samples, lead in acidic soil produced a blue color. When a base was added, a black precipitate formed. All samples with lead present were also highly acidic.
We also tested for soil nutrients, including phosphate, nitrate, and potassium. The only correlation was that the soils with higher levels of lead had higher potassium levels overall, but the correlation wasn’t completely certain.
Sean tests for nitrogen in the samples
I had seen an interesting device demonstrated at a workshop for the landing of the Curiosity rover on Mars where we used reflectance spectroscopy to analyze rock samples representing Martian rock analogs. The ALTA II device uses 11 LED lights on the bottom to shine off of a rock or mineral sample, then a detector shows the relative reflectance of each wavelength, ranging from blue through red to four frequencies of infrared LEDs. Using a white paper and a black paper as controls, the percent of reflected light can be determined and charted. Before Intersession began, I had the chemistry students use the ALTA on a series of chemicals. Some were white but of different substances, some were pure elements, such as copper, tin, lead, iron, and sulfur. Others were alloys such as bronze or compounds such as copper sulfate or minerals such as iron pyrite. I wanted to see if the alloys were an average between the pure elements that made them up, and to see if the infrared reflectance was different even though the visible colors of substances were white.
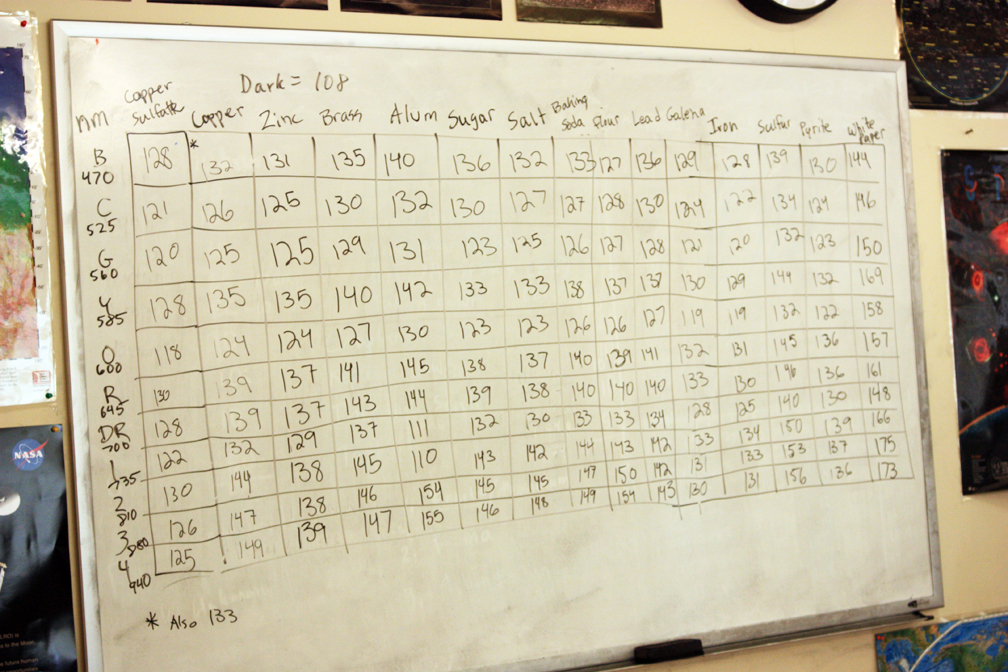
Reflectance spectrometer readings for various chemicals and minerals. There are 11 wavelengths read for each sample, which are compared to the values for white and black to get a percent reflectance.
We also used the ALTA on each of the soil samples, and the results were fairly predictable in that the richer, loamier soils had lower reflectance at all frequencies (they are darker). The more mineralized and contaminated soils were lighter (more yellowish overall) and high reflectance. Yet the yellow soil didn’t necessarily have higher yellow reflectance – it might have higher green and red, which were combining to make yellow. This spectrometer isn’t specific enough to really give detailed reflection spectrums, which would show spikes at specific frequencies for lead or other elements.
Recording data for the reflectance spectrometer on the Tintic soil samples.
Doing 11 wavelengths of light for 42 samples created a huge data table. We also had all the nutrient, pH, and lead data. Jem set it all up in a massive spreadsheet. Our ten-day class finished before we had the chance to analyze the samples from our final collection trip, so another student, Jeffrey, continued to work on the samples on his own time. By the end of the school year the results were all finalized. I’ll talk about those results in my next post.
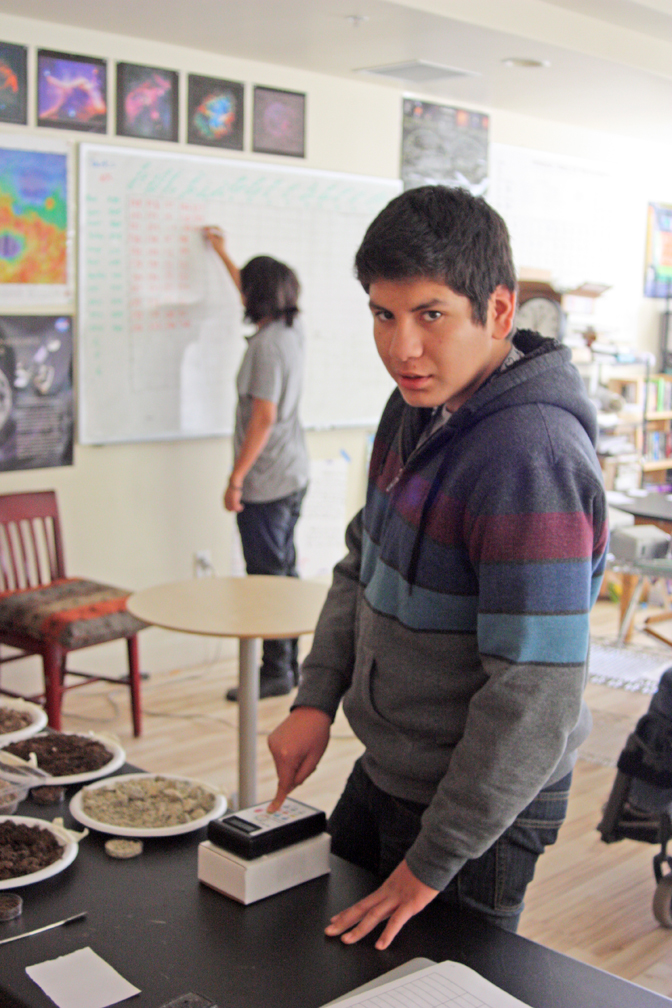
Jem enters all the data into a spreadsheet.
