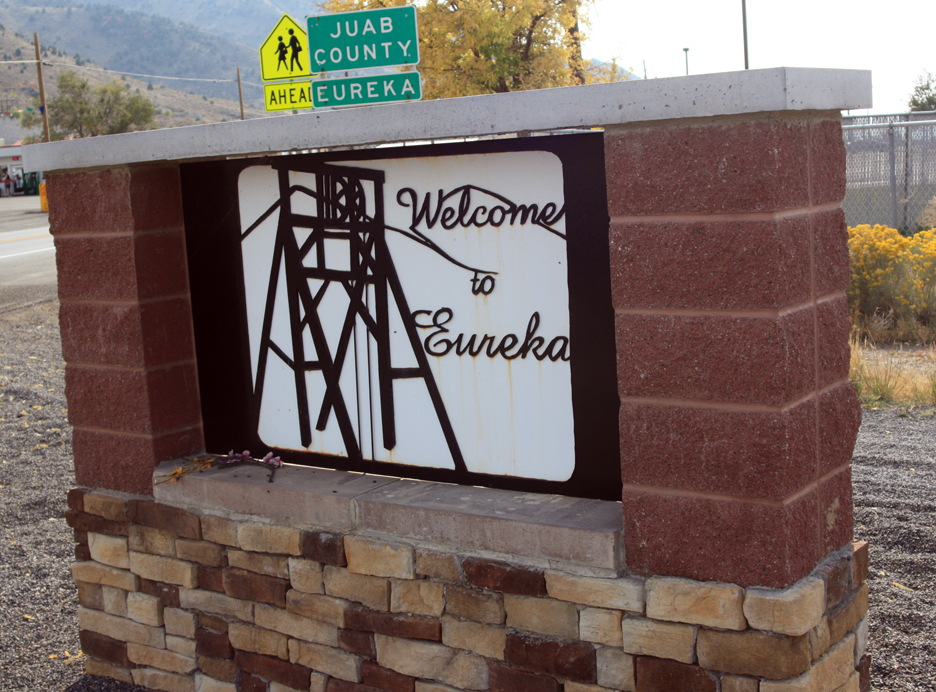
Welcome to Eureka sign on U.S. 6
It’s time to take a break from recounting my tour through Colorado’s mining towns last summer and catch you up on what we’ve been doing this year at Walden School of Liberal Arts.
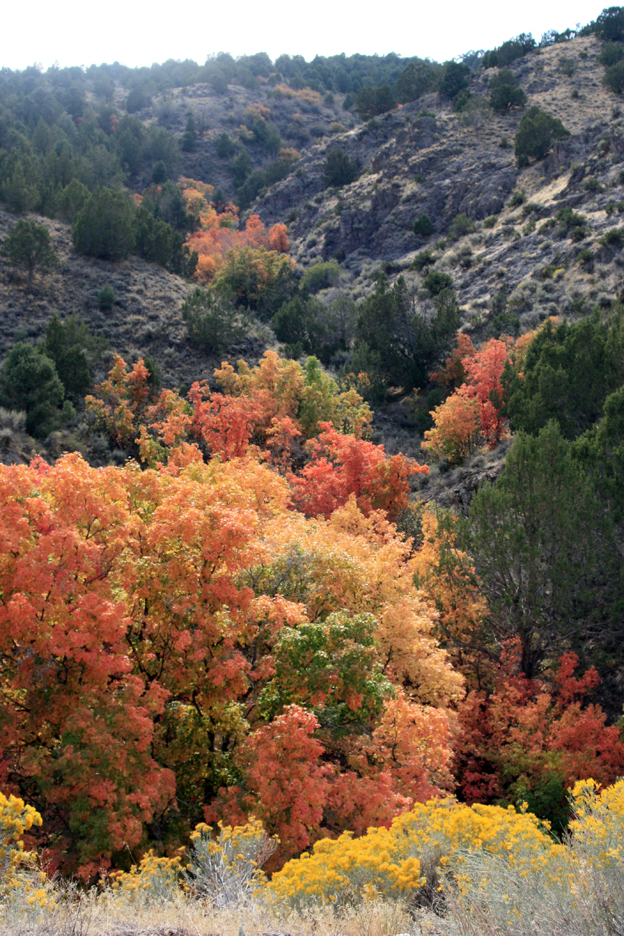
Maples in the fall near Eureka, Utah – with junipers and rabbit brush.
As mentioned earlier, we received a grant from the American Chemical Society to study lead contamination in the soils in Eureka, Utah and the surrounding area. The grant provided funds for travel, equipment, chemicals, and supplies. It took until early October to receive the money, so our first trip down had to wait until mid-October. It meant we wouldn’t have much daylight, but we’d have to do our best.

Canyon of Fire: Maples in the East Tintic Mountains
I’ve been gradually documenting the history of the area, collecting historical photos, taking photos around the town myself, etc. Back in 2009, I took a group of students with me to interview June McNulty, President of the Tintic Historical Society. He showed us through the museum and we videotaped the tour. Now, with this grant, we can tell the story of recent events in Eureka, especially the history of the EPA superfund project over the last ten years that cleaned up or covered up contaminated soils in the town.
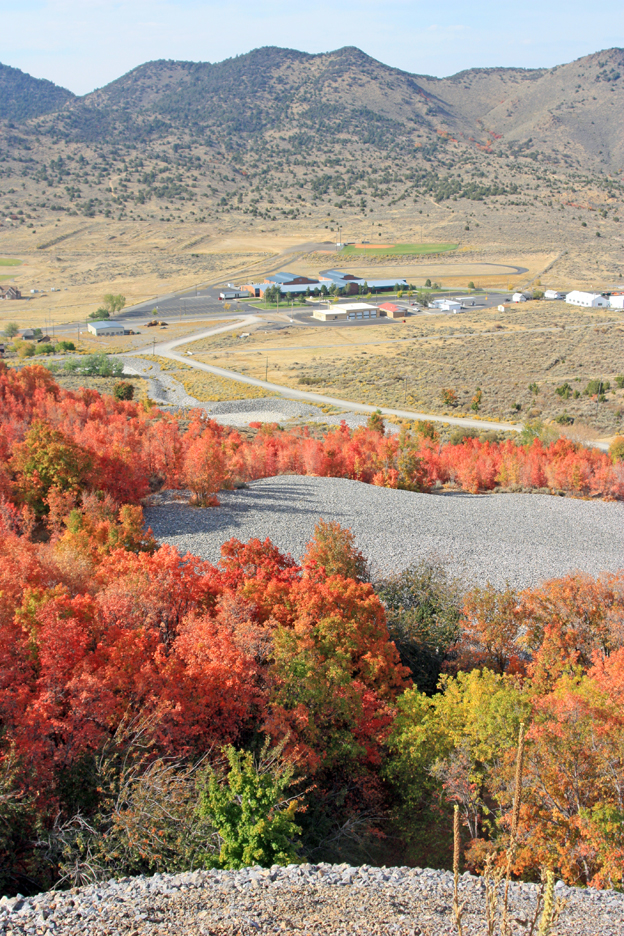
TIntic HIgh School from the Godiva Mine site
My science research class researched the history of the area during first term while we were waiting for the grant funds. They identified 20 collection sites outside town using GoogleEarth. Some of these are old mine waste dumps, some are around smelter or concentration plants or leeching piles. Others are control sites outside the district. We were going to collaborate with students at Tintic High School, who were to collect from sites in town. Unfortunately, our collaboration fell through, so my students eventually collected from sites inside the town as well.

Valley of maple trees from a mine dump in the East Tintic Mountains
In preparation for our sample collection trips, I traveled down to the area to get some photos of fall foliage on Saturday, Sept. 22. I got there just at the right time, when the maples in the canyons were at their brightest. I photographed some areas along Highway 6 leading into town and filmed the maples in the canyons along the road leading over the top to Dividend. I then took videos around town by attaching a Flip camera to my left rearview mirror with a small claw-style tripod. I drove up to the Godiva mine site and took photos down toward the high school, then drove further up the canyon past the Knightsville site and hiked around some mine dumps further up. I had seen that there was a valley nestled inside the East Tintic Mountains from GoogleEarth and my 3D models of the area. There was a road leading along the edge of the hills, and I walked around as far as the site of the Iron Blossom #2 mine. The headframe there has recently collapsed. It was a nice trip and the photos turned out well. I also saw and photographed several deer.
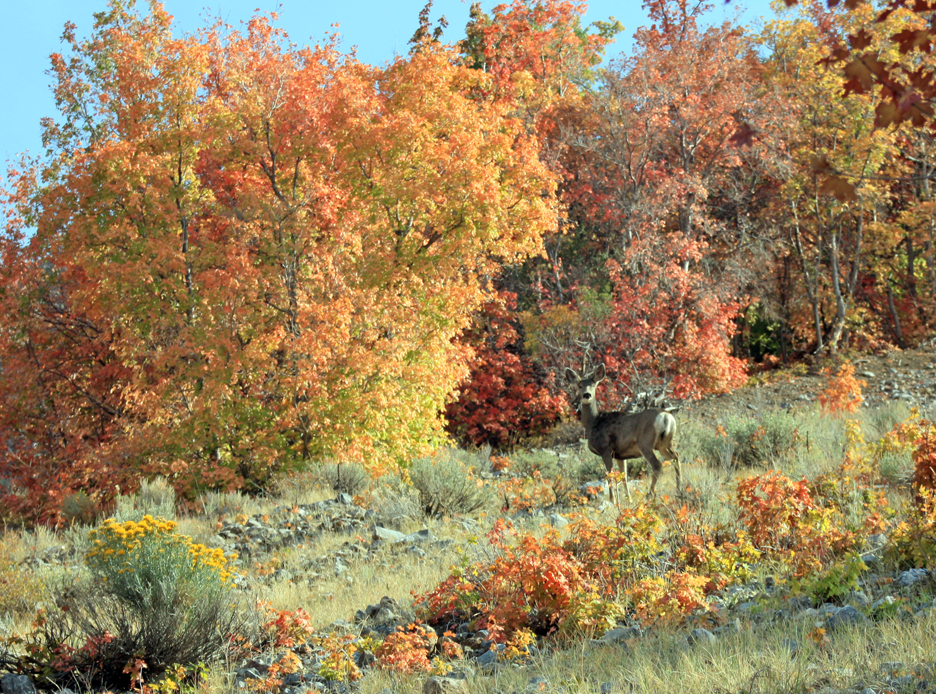
Doe a Deer: A mule deer doe in the East Tintic Mountains
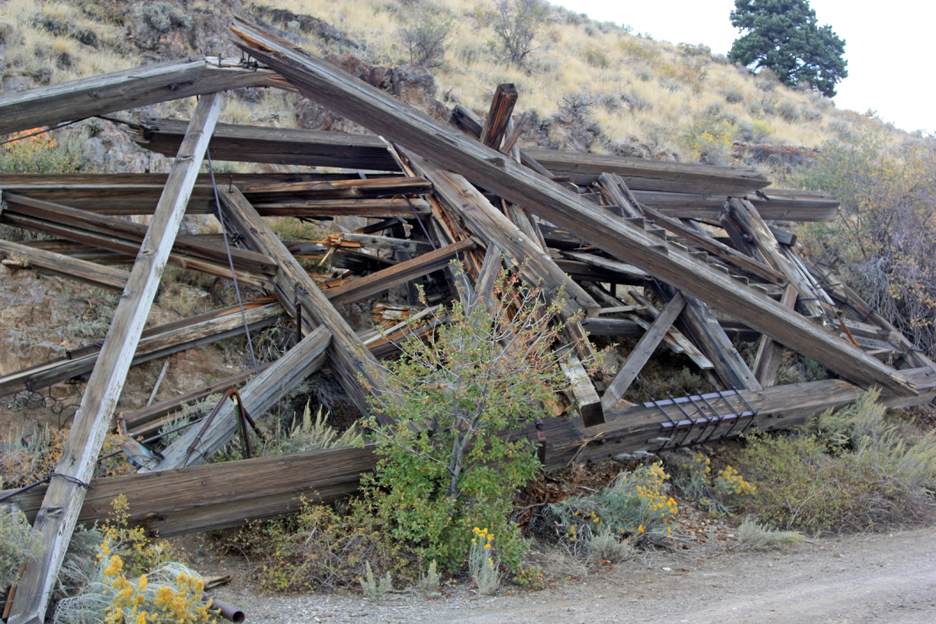
Ruins of the Irom Blossom #2 Headframe
I took four students to the area on Oct. 19 and we collected samples and explored the area, including the road over Silver Pass. We first collected from some old evaporation ponds near Elberta where hot water pumped out from the Burgin mines was allowed to cool and settle before discharging it into Utah Lake. During the early 1980s, as I drove home from college to my hometown of Deseret, I would pass through this area and see the water steaming as it passed down the gulley to the ponds. This was the last time they had attempted to open the mines at Burgin. We sampled from two locations inside the old ponds, which can be reached by a short walk from Highway 6.
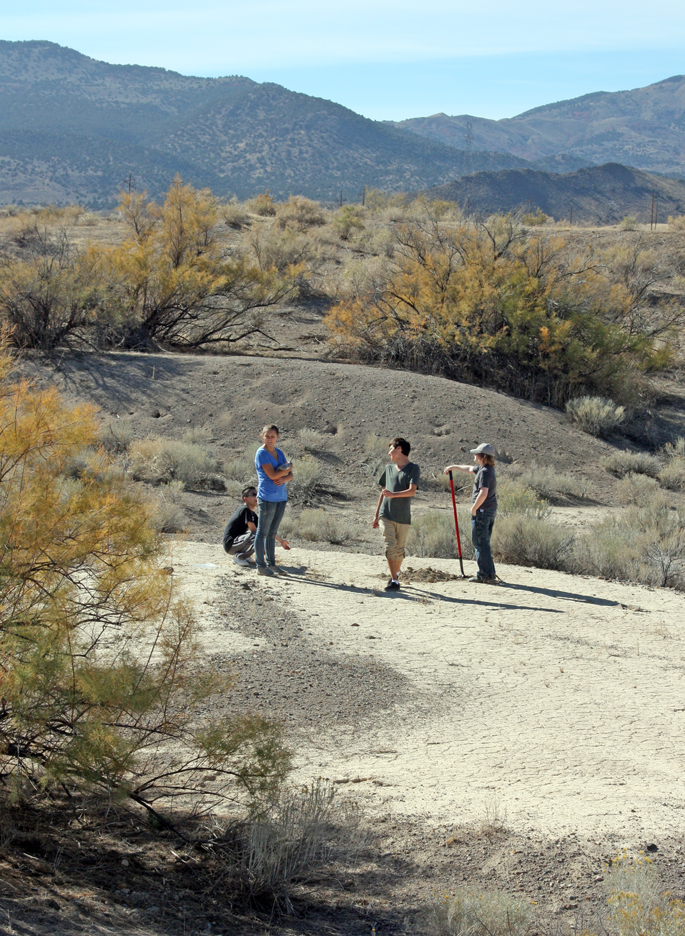
Collecting samples at the settling ponds near Elberta
We then collected from the bottom of the wash at the mouth of the canyon leading up to Burgin. The soil here looked healthy and contained a combination of sand and humus. We then stopped at the old Burgin concentrator and took some pictures. I talked with the men at the main office of the Chief Consolidated Mine operations there about getting some samples from the tailings piles (they corrected me when I mentioned “tailings piles” around the headframes themselves and said those rocks were more properly called mine dumps or waste rock; tailings are the actual ore that has been processed).

Silver ore concentration plant at the Burgin mine
We took photos around the Trixie headframe, then drove on up the canyon over the top of Silver Pass, which I had not done before. This was the opening of the deer hunt, so I didn’t want to venture too far from the road without orange clothing.
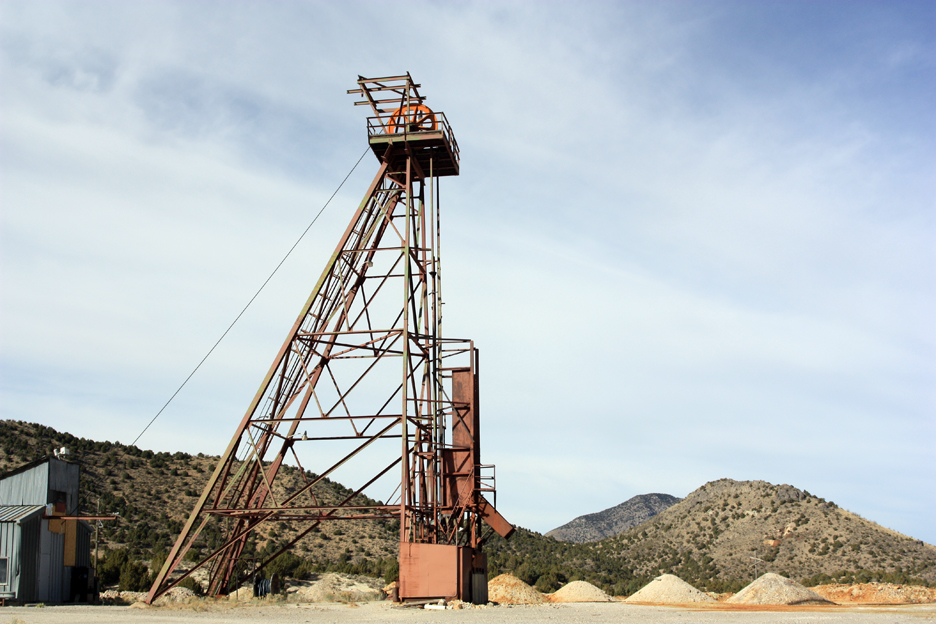
Headframe at the Trixie Mine above Burgin.
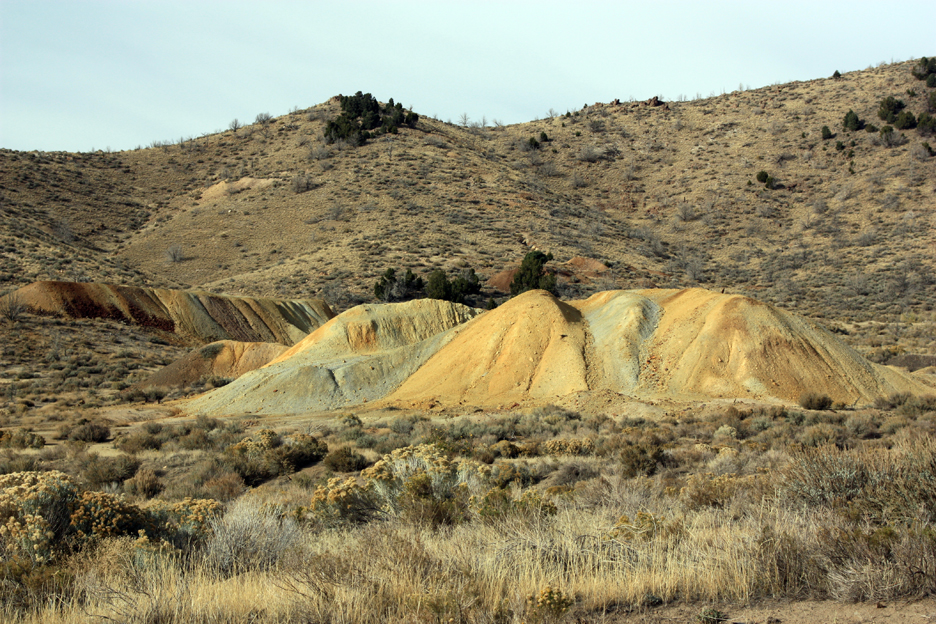
We also collected at a mine dump next to the road in Ruby Hollow, which I later identified as the Tesora Mine. The soil there had a bright yellow color and contained obvious sulfides. Part of the shaft is still there without much protection around it.

Collecting samples at the Tesora Mine dump in Ruby Gulch
I also showed the students Silver City, the leeching pile from the 1980s when much of the waste rock and tailings were heaped up and cyanide solution was sprayed onto it, chelating the silver and gold out of the rocks. We stopped at the Bullion Beck headframe for photos and walked around the Tintic Mining Museum. It was late afternoon by then and time to get the students back.
Waste rock pile at the Swansea Consolidated Mine near Silver City
Altogether we collected six samples from three sites and the students had a chance to get to know the area. I knew that we would have to be more productive on our next trips. Back at school, we did some simple pH tests and found the first two sites (Elberta Ponds and Burgin Wash) were near neutral pH, but the Tesora Mine samples were quite acidic, at a pH of about 3.5. Other tests would have to wait until we ordered the testing supplies.
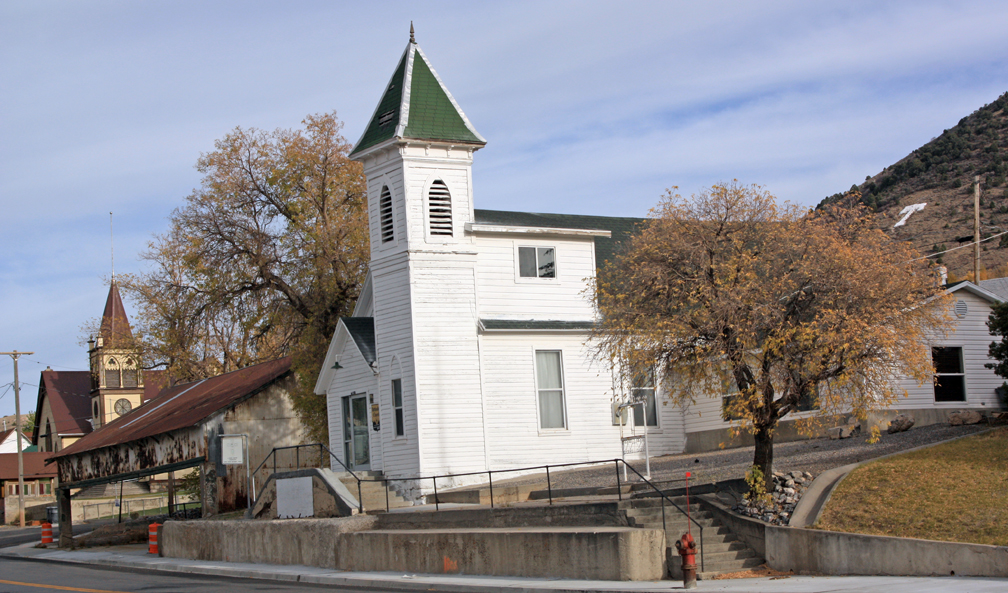
Historic churches in Eureka, Utah.
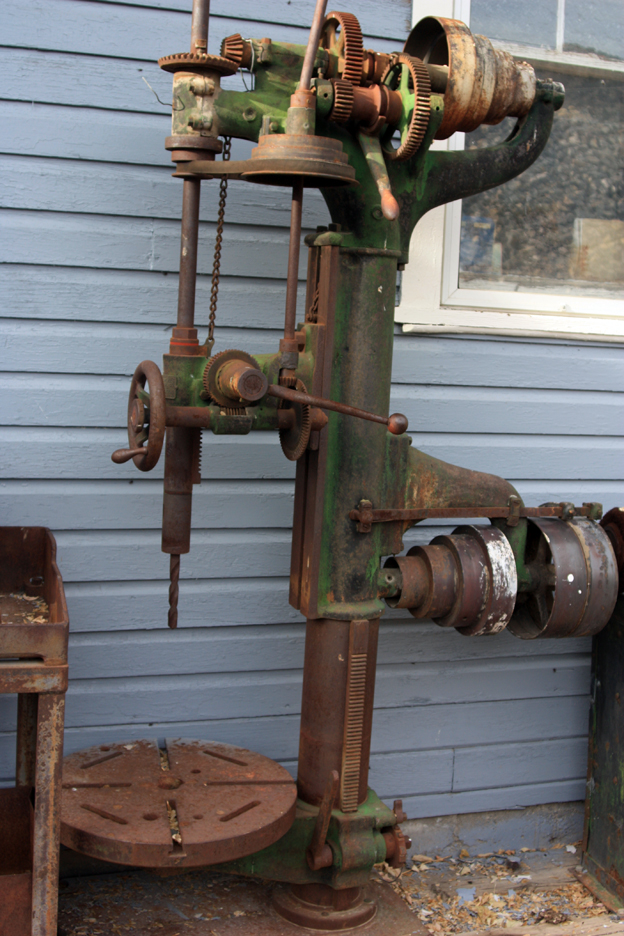
Belt-driven drill press at the Tintic Mining Museum
 Belt-driven drill press at the Tintic Mining Museum


