With the beginning of the 2013-14 school year, I’m pleased to announce the start of a new program in my classes at Walden School of Liberal Arts. I call it the STEM-Arts Alliance, and it’s an attempt to bring artistic expression and creativity into my STEM (science, technology, engineering, and math) courses.
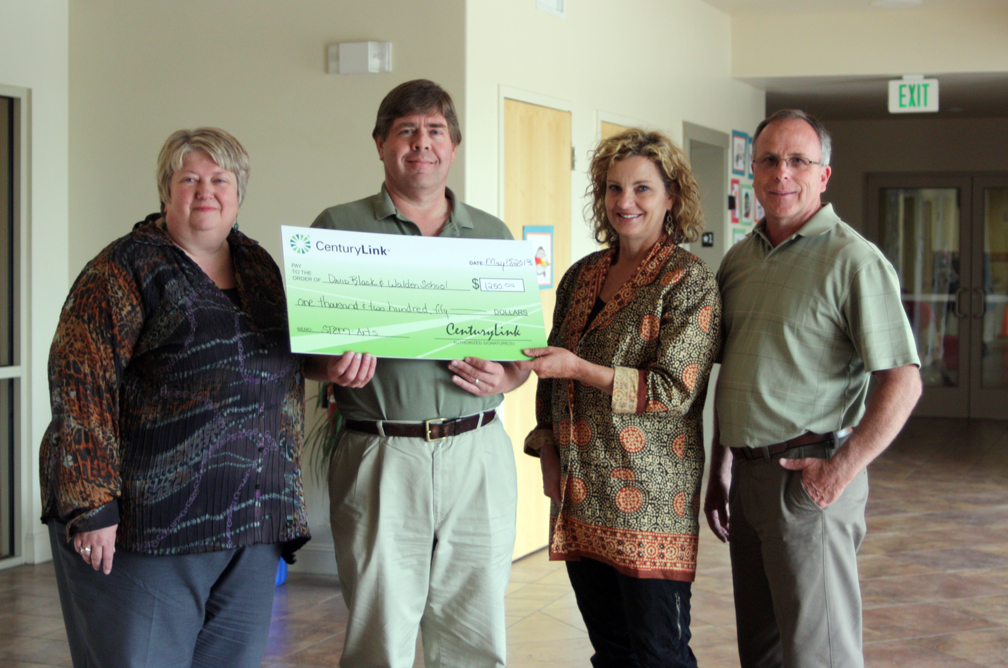
Receiving the award from CenturyLink Foundation.
I have several reasons for doing this. First, I hope to broaden our students’ participation in upper-level science and technology courses. Given the size of our school, we could have more students taking courses such as chemistry, physics, astronomy, anatomy, and environmental science. We are a public charter school with a liberal arts emphasis, which means we get a high percentage of creative, passionate, out-of-the-box-thinking students. We need people like this to choose careers (or at least become more literate) in the sciences. My solution is to broaden the appeal of our science and technology courses by integrating the students’ strengths and interests. This is not to say I’m making my courses any less academic; it just means we’re using the arts as a continuing theme, by looking at the art of science, the science of art, and the history of both.
Second, I happen to love drawing and painting and rarely have time to do it. My artistic passion is somewhat satisfied by 3D animation and video production projects, but there’s just something about holding a paintbrush or an ink pen and seeing a project emerge from paper. I’ve been pulled in four different directions all my life; I seem to keep swinging between science, media design, history, and fine art. So I’m creating lesson plans and projects that incorporate all four of these areas, projects that are based around my own passions.
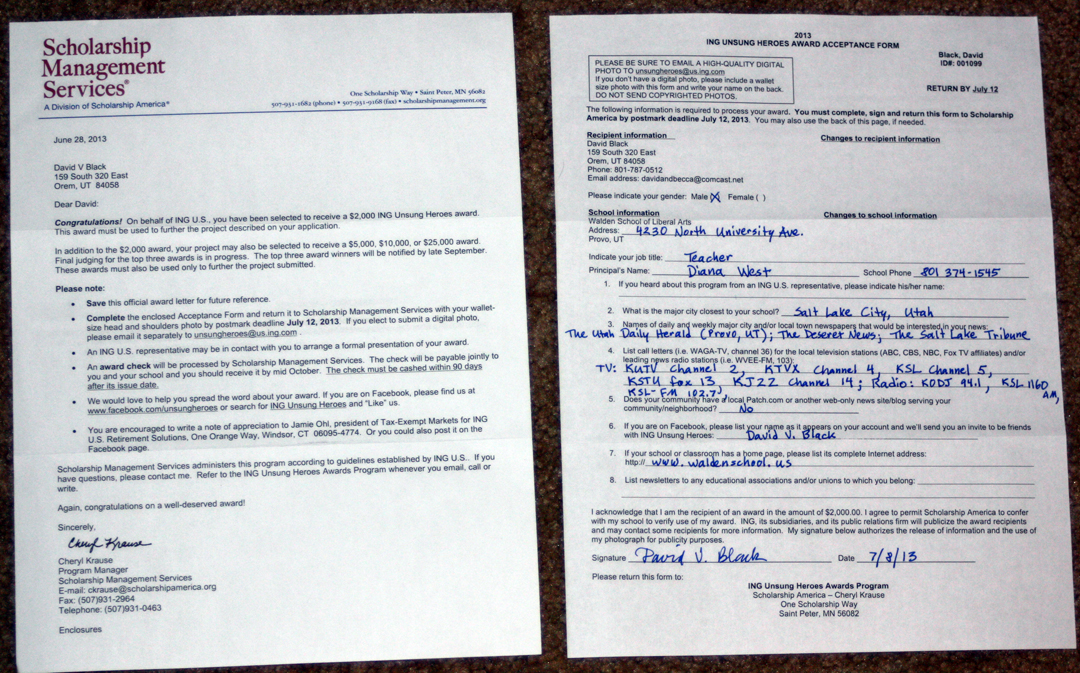
Award letter for the ING Unsung Heroes Award. It’s always a good day when you receive one of these!
Third, I hope to enhance the stories of science we’re telling by bringing my students’ artistic skills to bear on science topics. When I did some line drawings of Greek matter theorists (such as Thales, Parmenides, etc.) I found that they were frequently downloaded. Apparently, people are tired of finding only the few standard photos showing busts of Aristotle and his colleagues in some museum. Why not put myself (and my students) to work, creating new images in the cause of science education and fine art? I soon hope to complete the Greek Matter Theories videos I began four years ago, and I need more materials and images. Now I can do two things at once. I can draw illustrations of Aristotle or Democritus for the Greek videos while simultaneously teaching the chemistry of ink or paint pigments.
Fourth, our school is building up to become an International Baccalaureate (IB) school with a Middle Years Programme starting this year and growing to encompass 7-10 grades, with an additional Diploma Programme in our upper grades. The chemistry and technology courses are very much based on design projects and inquiry experiments while maintaining high academic standards. This is very much the model I have been working toward anyway, and my STEM-Arts Alliance should help my students transition into the IB chemistry and technology classes.
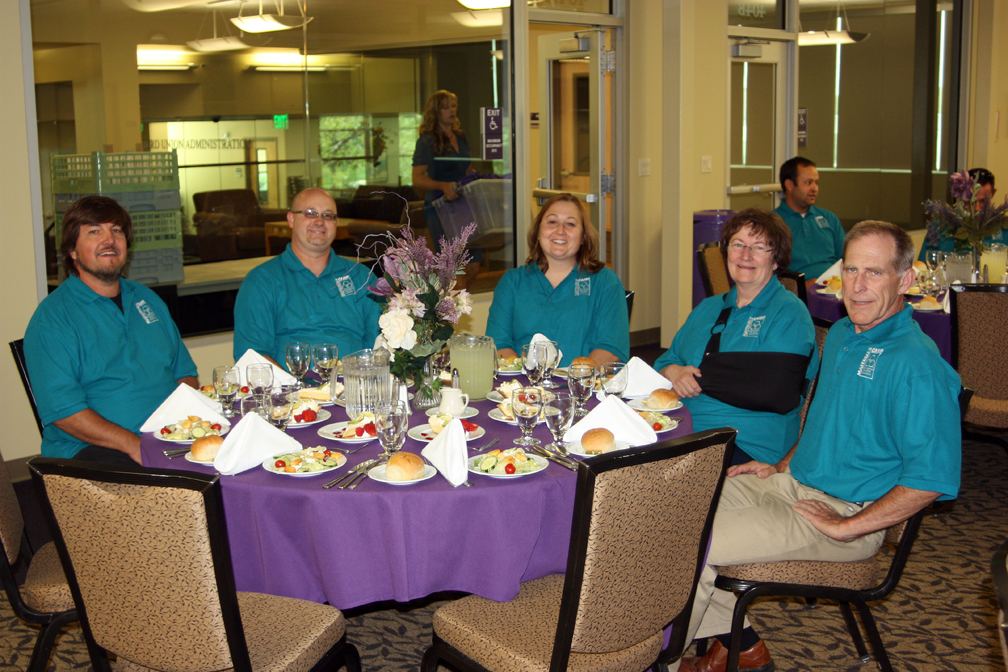
But to successfully implement my ideas, I needed funds and so I’ve been applying to every grant I can find. During this spring, I applied for five different programs, grants, or competitions, with three being due within two days of each other. True, it was made easier because all my proposals were similar, hoping that some would succeed. And they did! Two grants have come in. The first was $1250 from the CenturyLink Foundation. I received one of those large fake checks in May. I began purchasing equipment and supplies during the summer, including a GoPro camera, an audio recorder, a green screen, and a digitizing Bamboo tablet. These technologies will add to our ability to record video and audio, create digital images, and document what we’re doing in chemistry and astronomy in our two blog sites. We also purchased a new LEGO Mindstorms EV3 kit so we could start an afterschool robotics club. Here is a link to the CenturyLink Award: http://www.centurylink.com/static/Pages/AboutUs/Community/Foundation/teachers.html.

Receiving the award from Steve Platt of ING Foundation.
My second success was $2000 for the ING Unsung Heroes Award. They provide two such awards per state, and I thought I had a pretty good chance of winning one. I’ve purchased a new color laser printer (so much better than using the ink jet) as well as chemicals and supplies for the various lessons and projects we’ll be doing this year. I received a second large fake check from Steve Platt of ING this fall, as well as a nice plaque. I am still purchasing materials through this grant. Here is a link to the awards page in case you want to apply yourself: http://ing.us/about-ing/responsibility/childrens-education/ing-unsung-heroes.
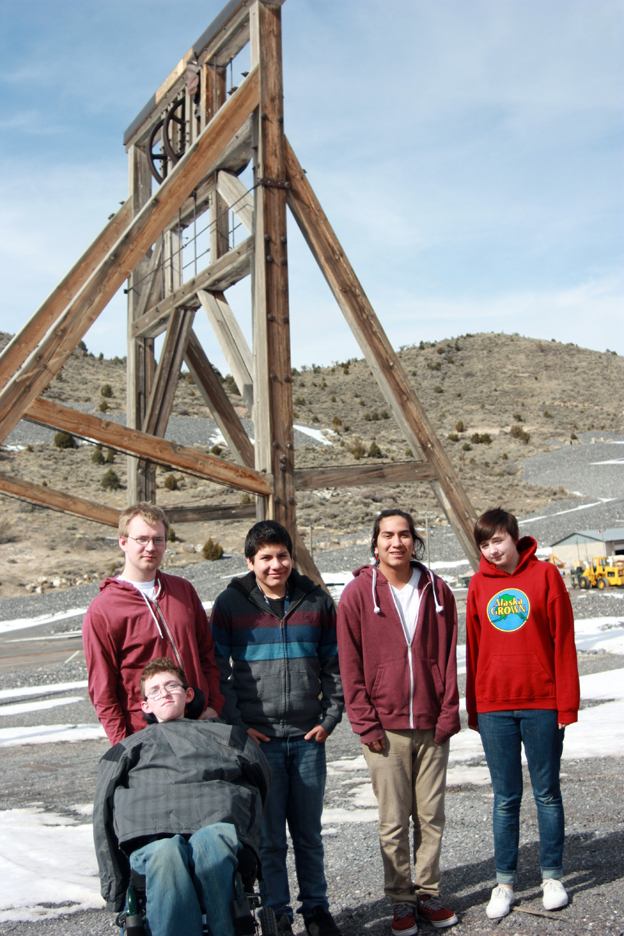
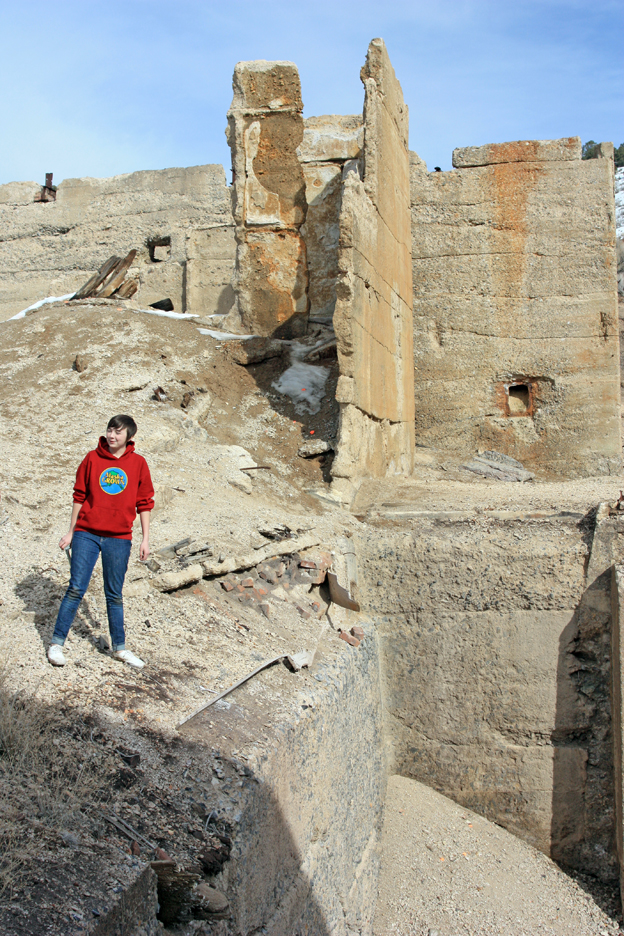
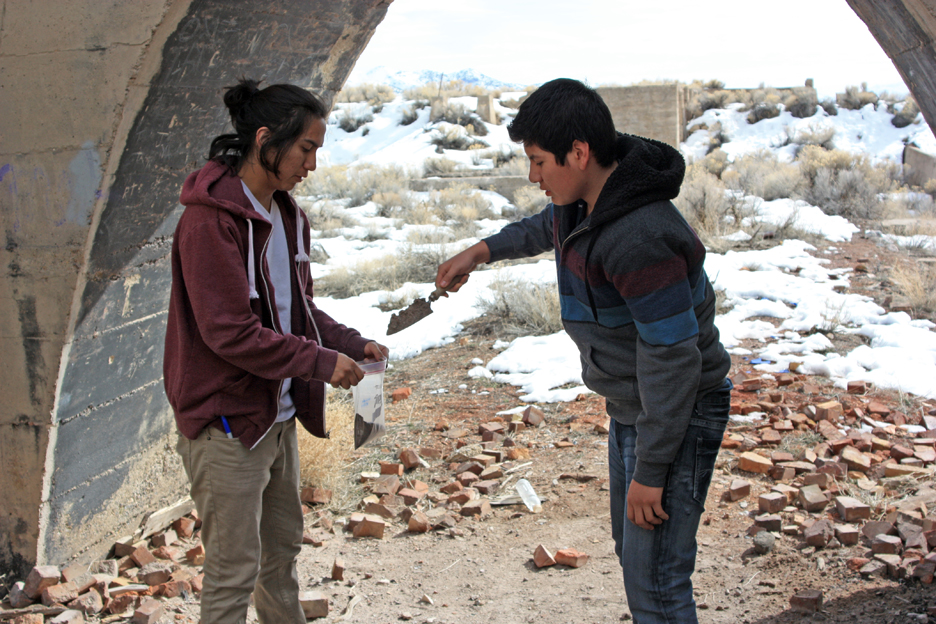
So far my students have worked on a number of different projects in several different classes and at Timp Lodge. They’ve accomplished the following:
1. We set up a summer media design class that culminated in organizing the video clips and recording green screen narration for the SOFIA video I’m putting together.
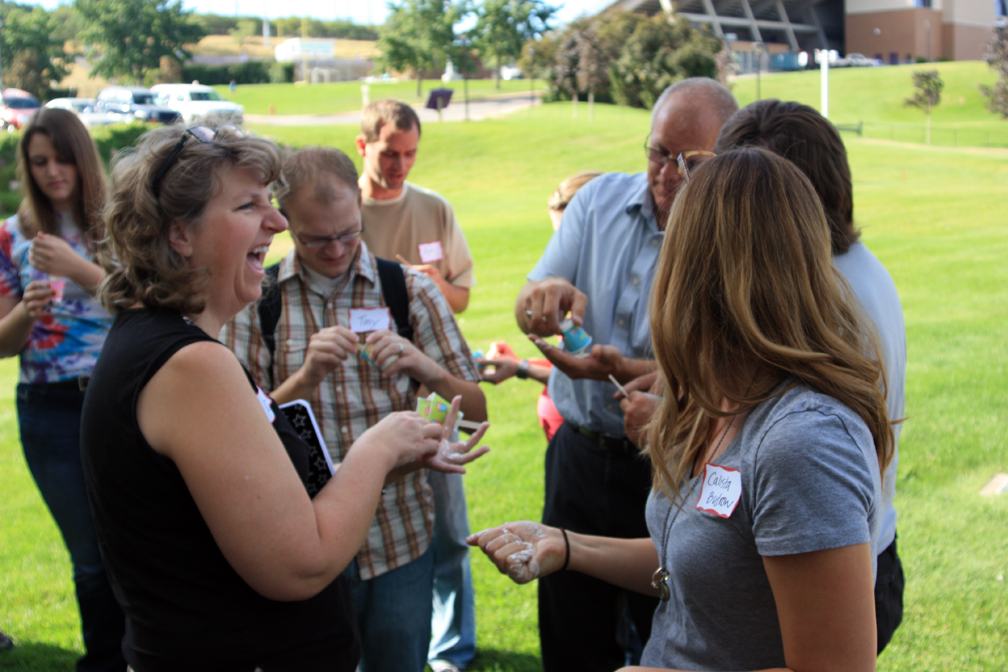
2. We made tie-dye shirts at Timp Lodge.
3. We made marbled paper using dilute oil paints floated on water (also at Timp Lodge). 4. Students edited the SOFIA videos and built 3D objects from SOFIA’s interior in the middle school Creative Computing classes.
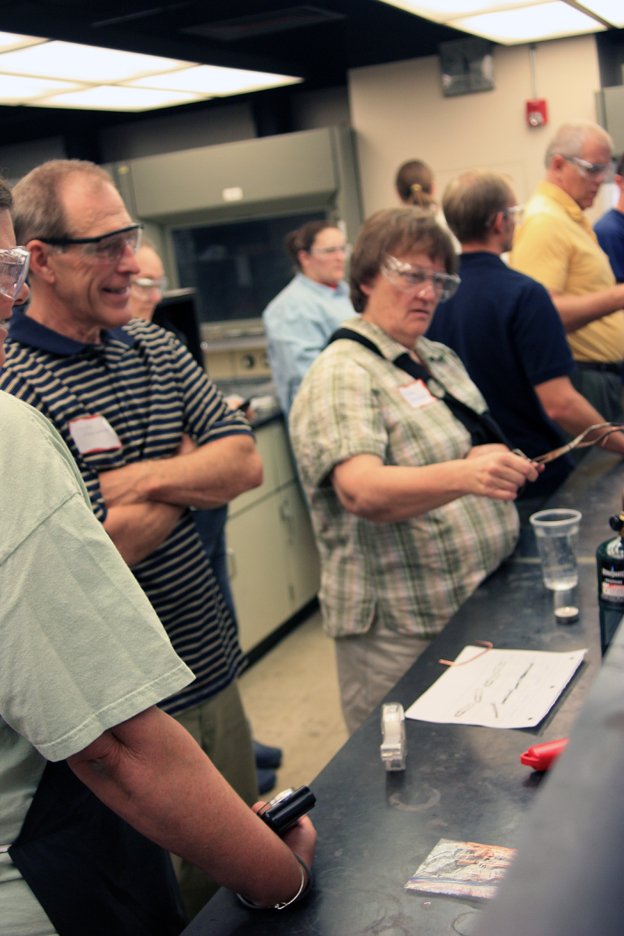
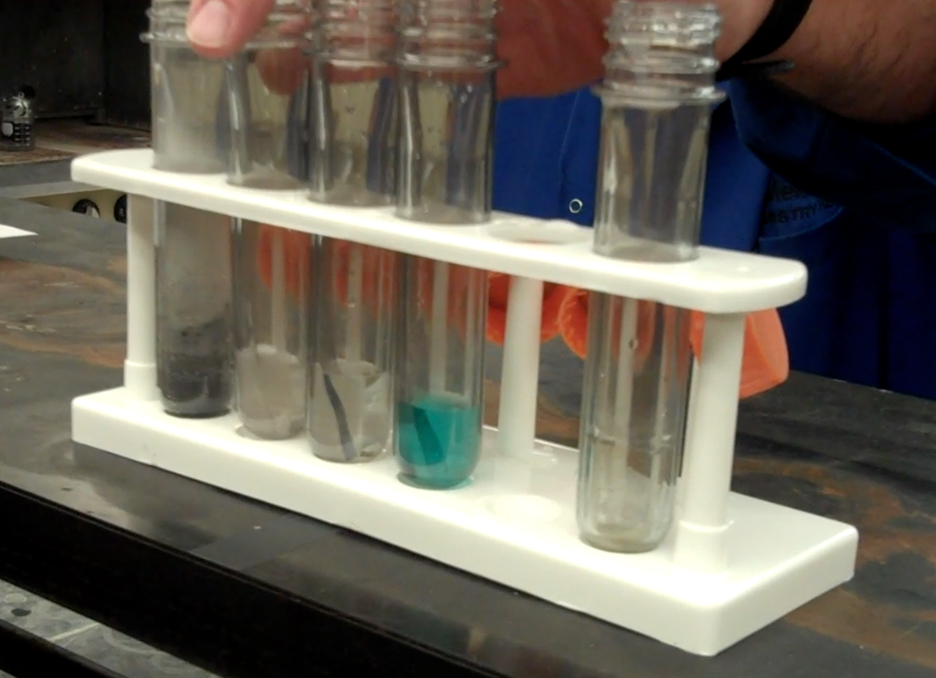
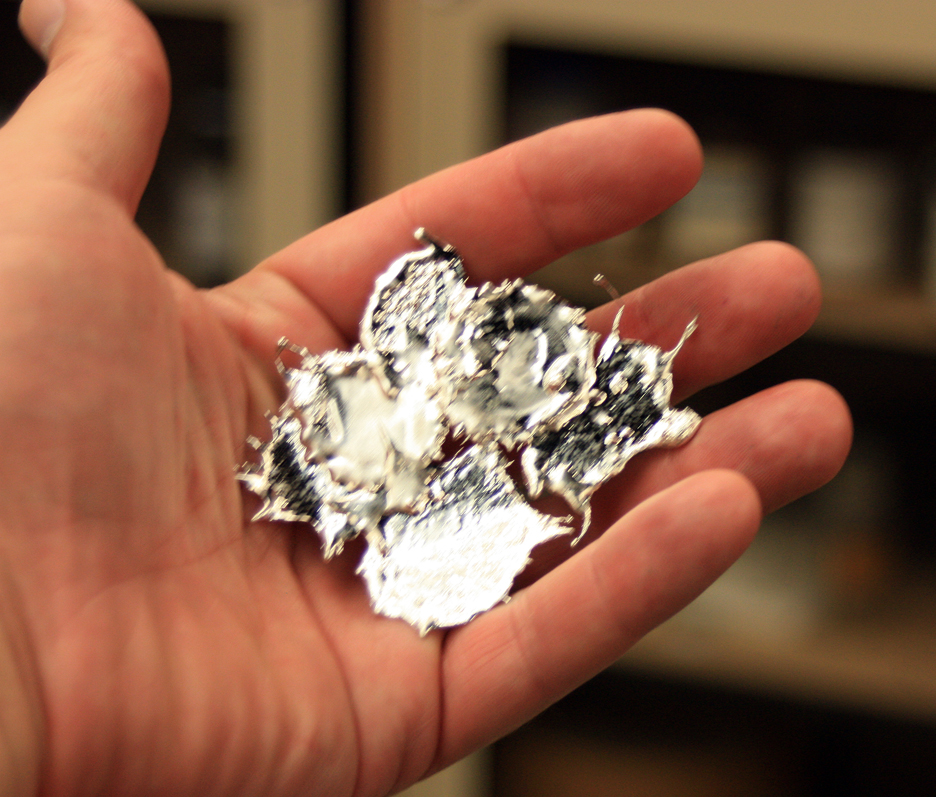
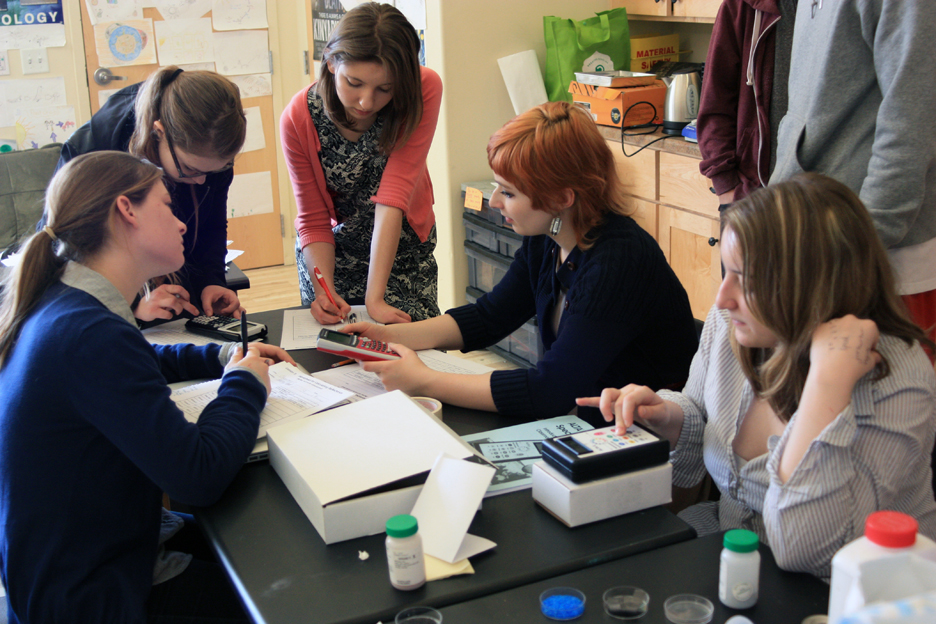
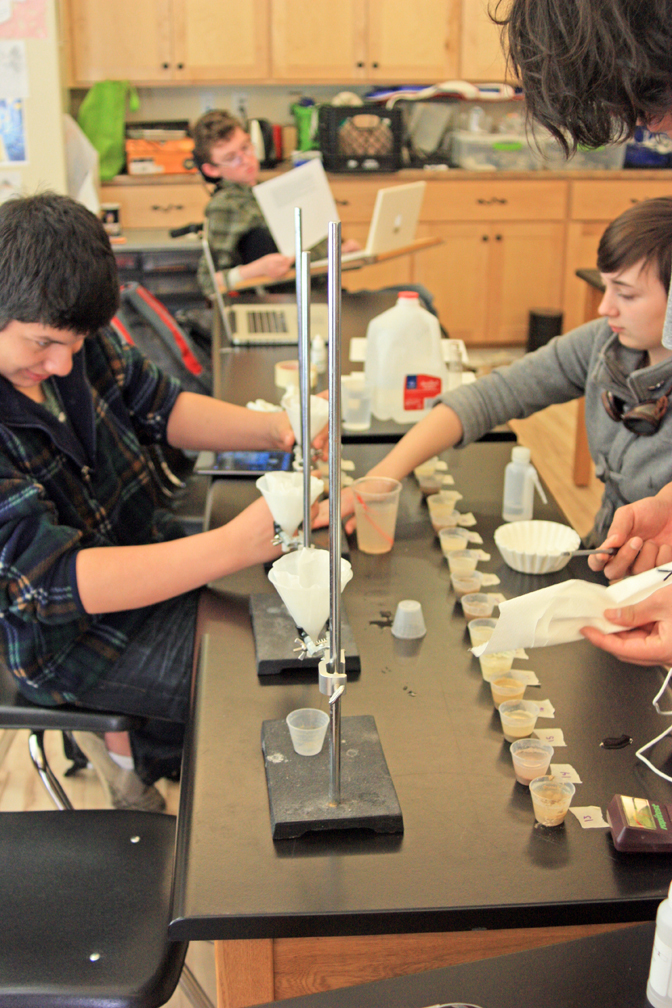
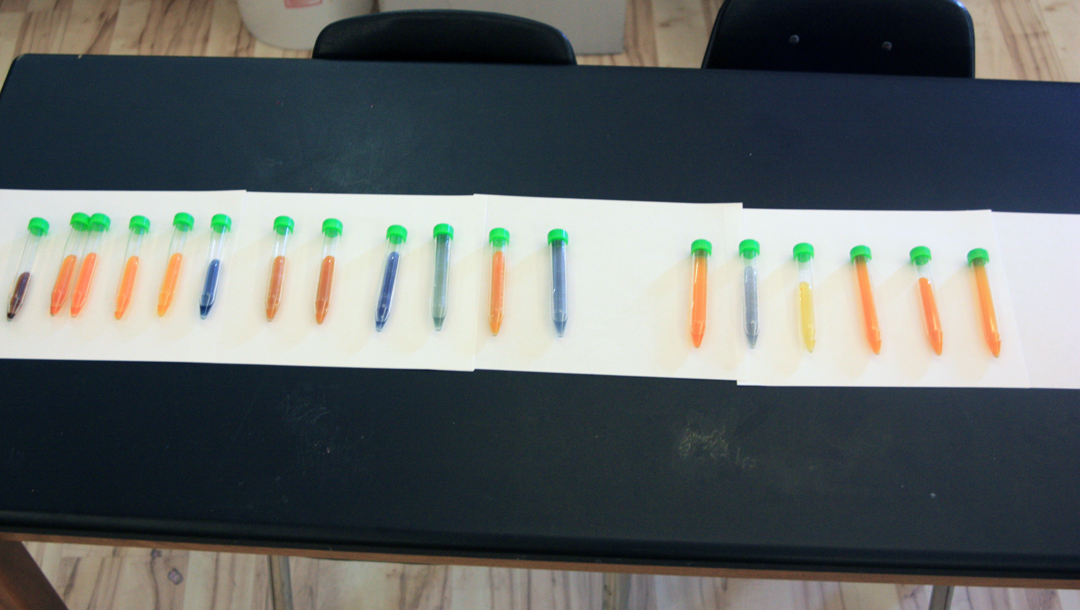
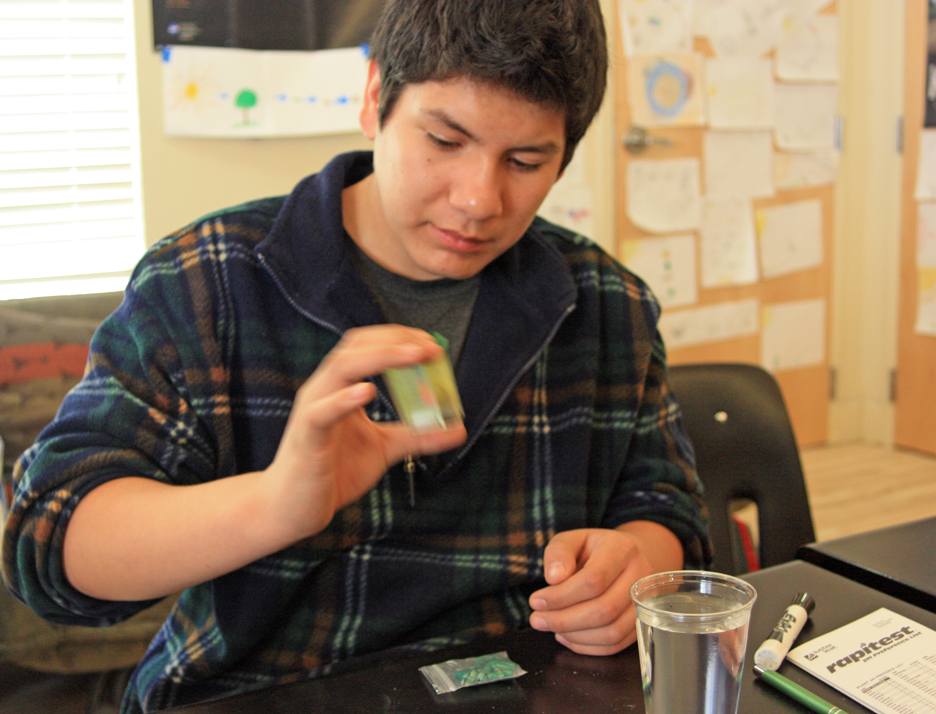
5. Students created iron-gall ink in chemistry and used it to draw pen and ink illustrations of science history concepts.
6. We started the robotics club after school, and students have built a rover capable of picking up small objects and moving them to new locations.
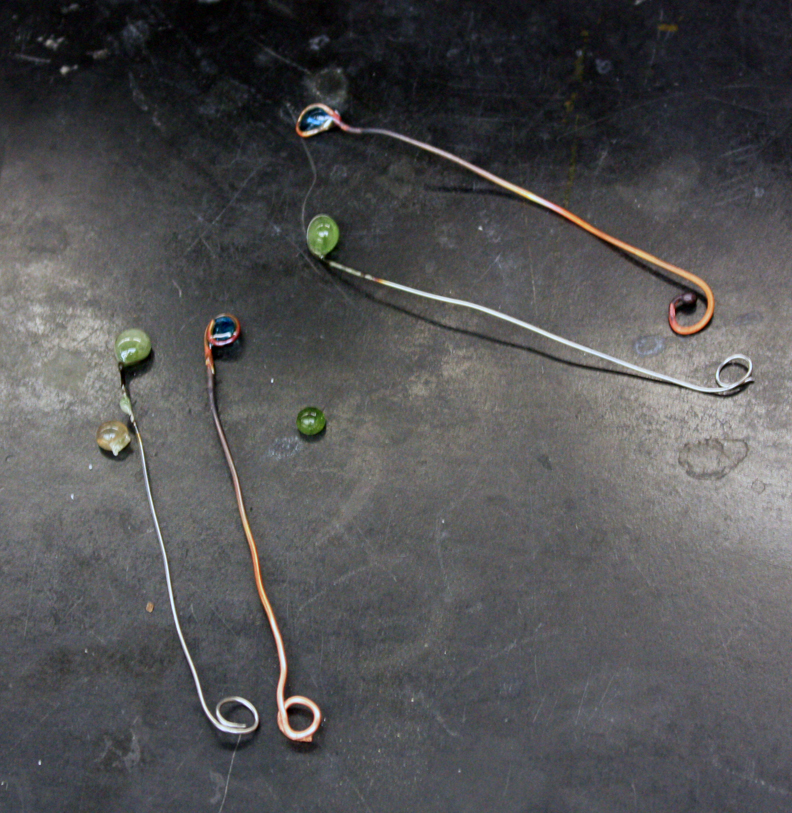
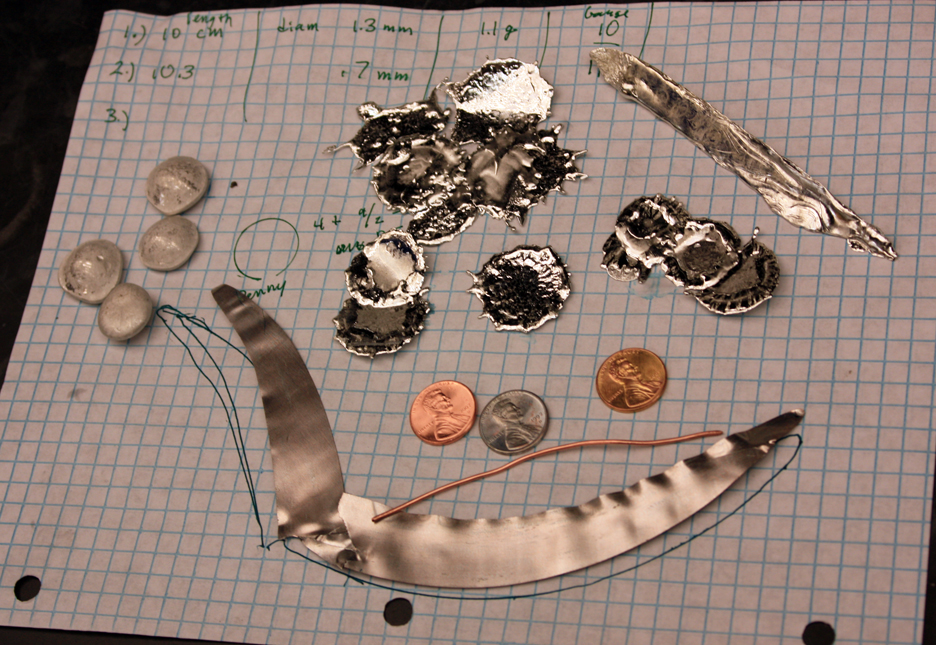
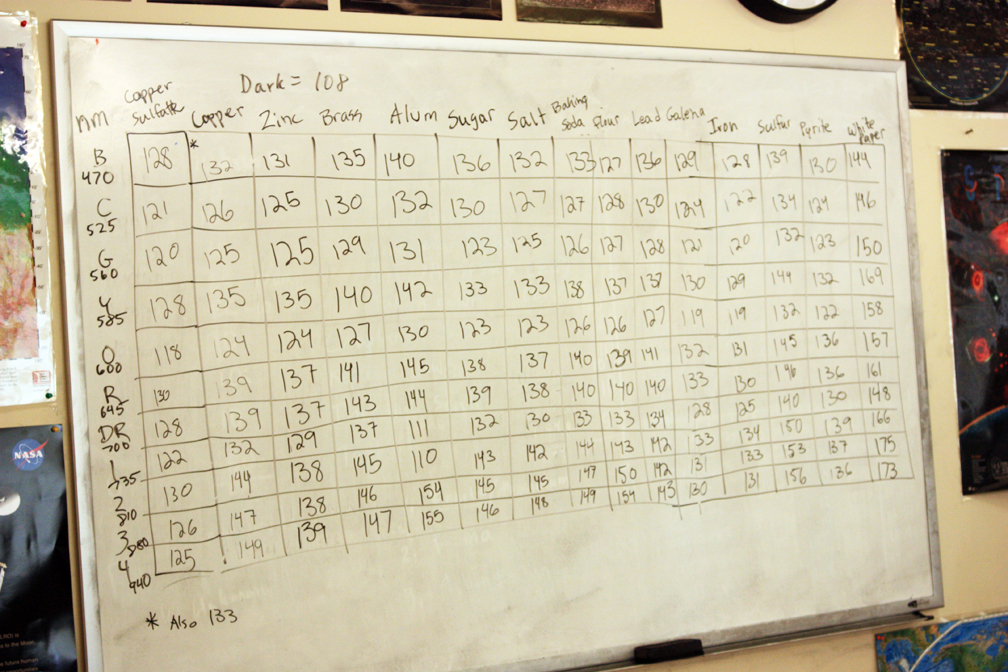
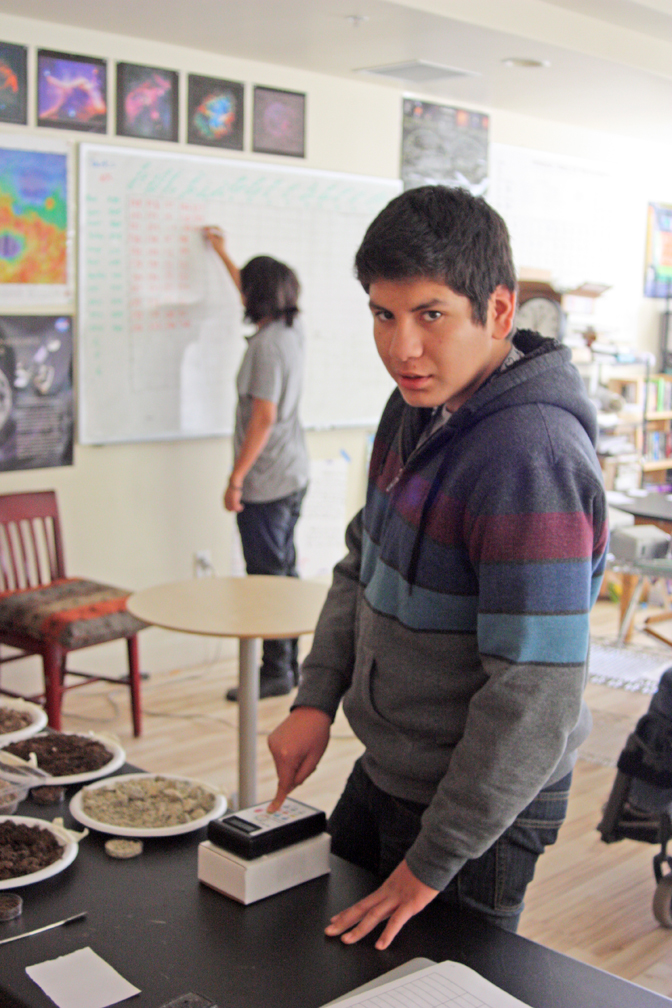
7. Students turned periodic properties of the elements into 3D models.
8. They built paper Christmas tree ornaments representing chemical elements.
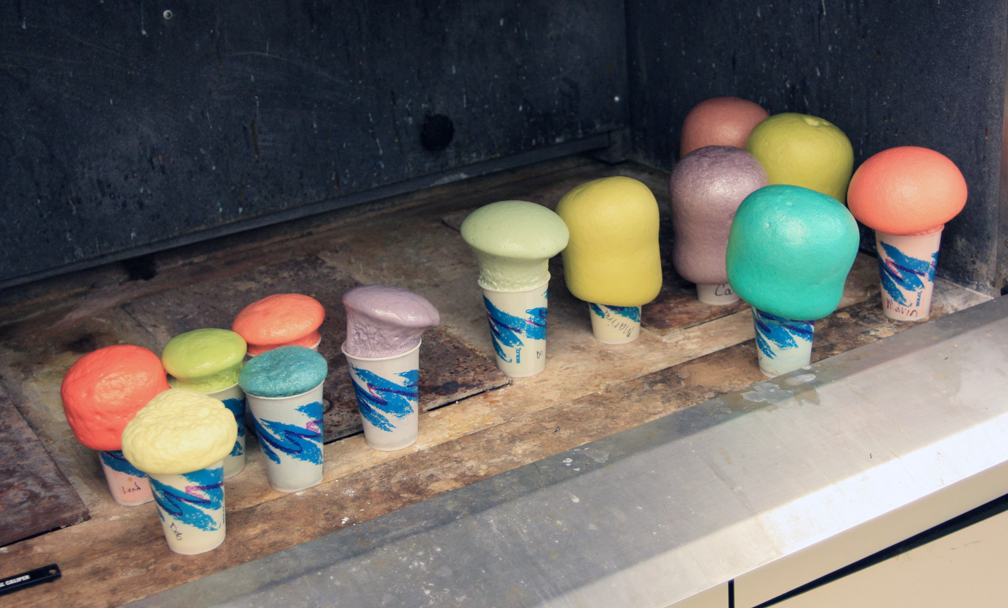
9. Students created homemade watercolor pigments and used them to make paintings of science history.
10. They wrote and narrated podcast scripts on astrobiology topics.
I’ll report in more detail on each of these in future posts. It seems that we’re still just getting started, but in reality we’ve been very busy and very successful already. All projects have a fine arts component, a technology component (all paintings are scanned and cleaned up in Photoshop), and a history component. We are literally creating modern versions of old formulas used in making art for thousands of years. And it feels great to have all my passions pulling in the same direction.
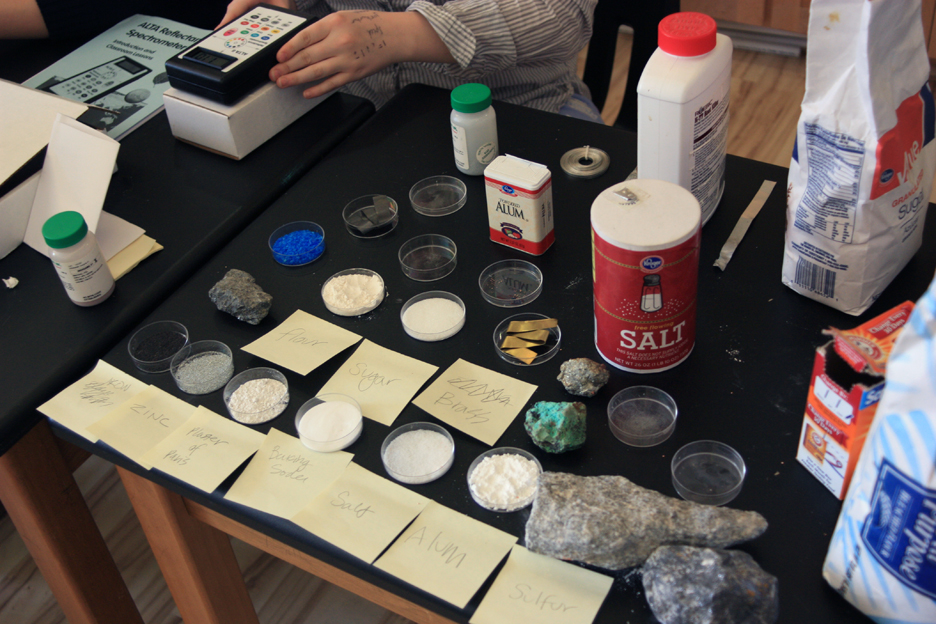
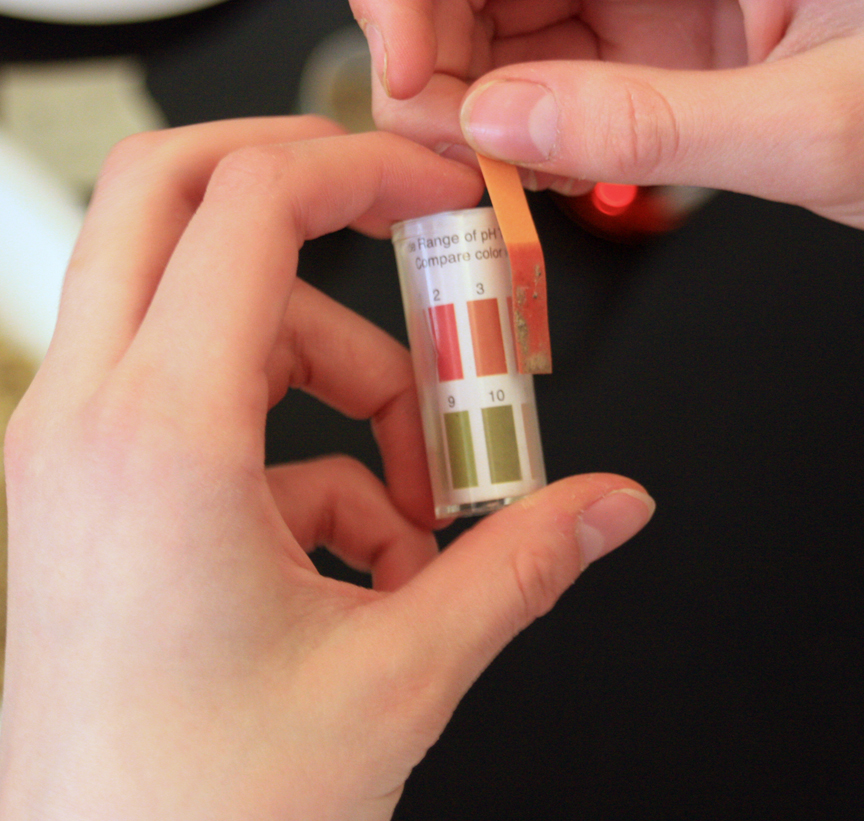
Most of these activities have been in chemistry class. I am starting there as an initial run through, testing the recipes I’ve found online so that I can perfect the processes for future classes. The chemistry students have done exceptionally, and they’ve proven to have excellent art skills on top of learning chemistry and experimenting with different formulas. I hope to set up a dedicated Science and Art class during our Intersession that will incorporate all these activities and hopefully more besides. I’ve written another grant to the Moss Foundation just to get an electric kiln to do Raku pottery. So far I haven’t received word, but should soon. I might do a second class for making junk sculpture out of found objects. It will be a combination of materials science, design, and engineering.
I’m having a lot of fun researching and designing these projects, and I hope you’ll have fun reading about them and trying them out yourselves.